

The US Labor Market Cools in February But Remains Inefficiently Tight
The US Labor Market Cools in February But Remains Inefficiently Tight
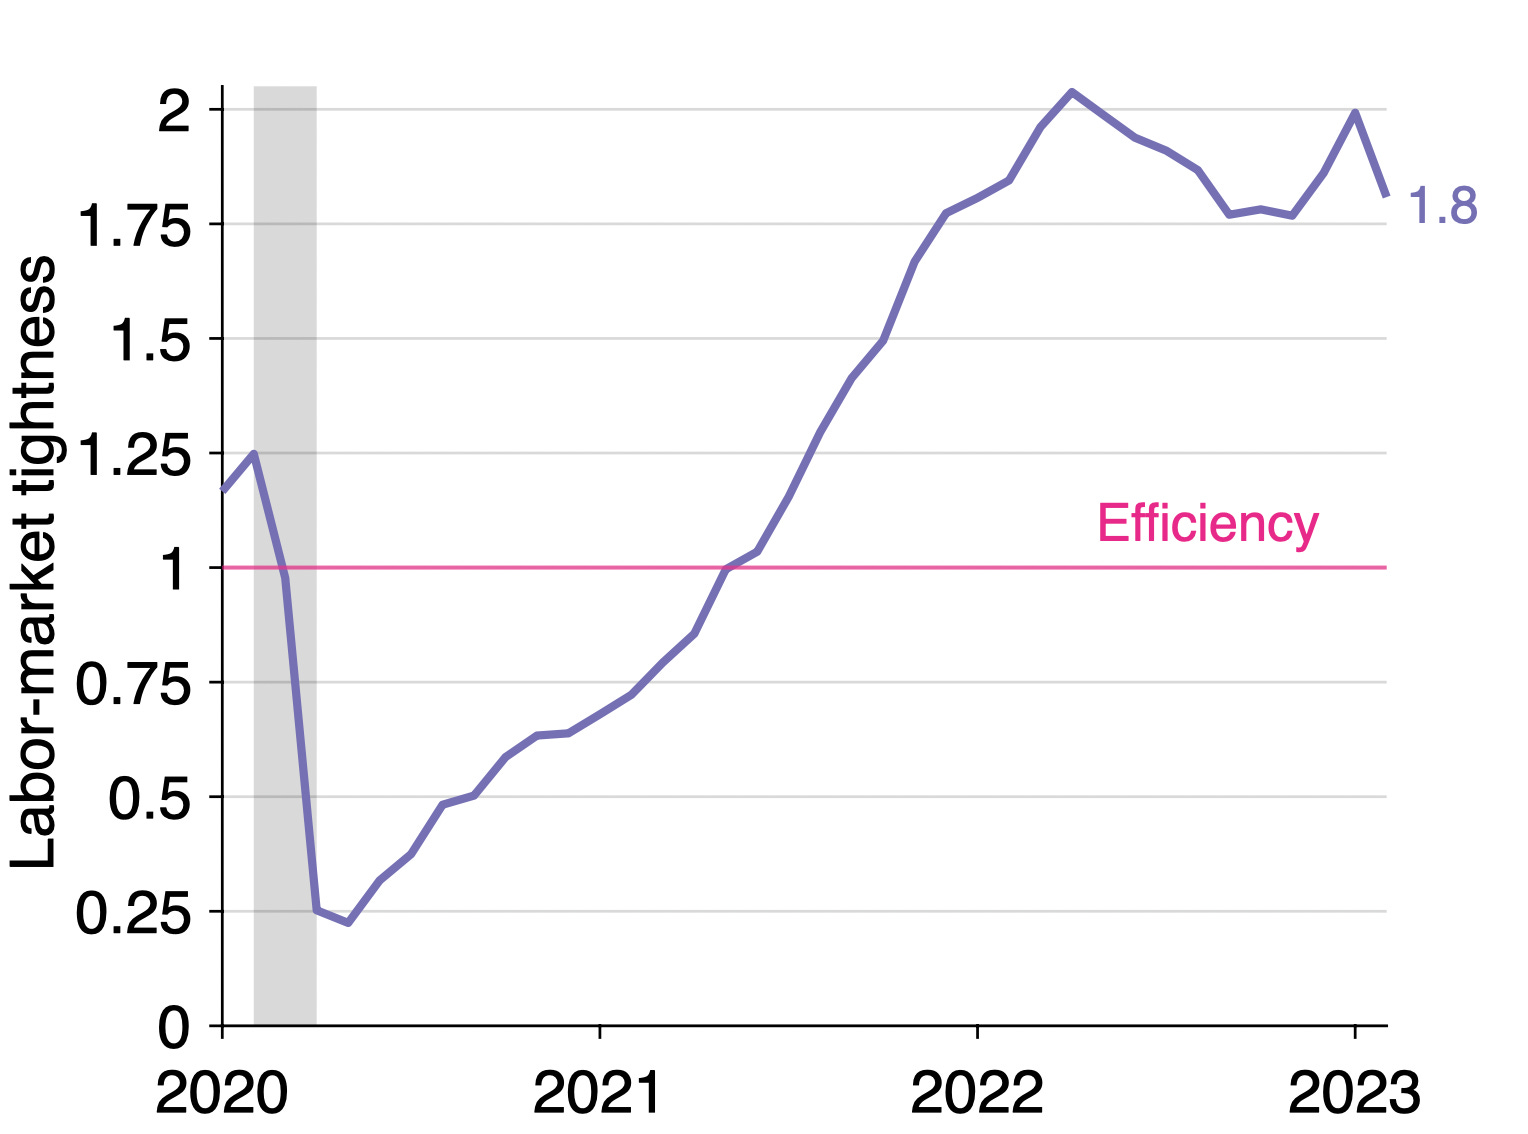
Numbers from the Bureau of Labor Statistics show that labor-market tightness fell from 2.0 to 1.8 in February—still above the efficient level of 1.
The US Bureau of Labor Statistics (BLS) has just released the numbers of vacant jobs and unemployed workers in the United States in February 2023. This post reviews the numbers and uses them to compute labor-market tightness, efficient unemployment rate, and unemployment gap. We will also look at the Beveridge curve and discuss some implications for monetary policy.
Where do the numbers come from?
The number of vacant jobs is measured by the Job Openings and Labor Turnover Survey (JOLTS).1 The number of unemployed workers is measured by the Current Population Survey (CPS).2 The CPS also reports the number of labor-force participants. These numbers then give unemployment and vacancy rates:
Unemployment rate = # unemployed workers / # labor-force participants
Vacancy rate = # vacant jobs / # labor-force participants
What are this month’s numbers?
The numbers for February 2023 are the following:
Unemployment rate: u = 3.6%. This is up from 3.4% in January 2023.
Vacancy rate: v = 6.5%. This is down from 6.8% in January 2023.
Labor-market tightness: v/u = 1.8. This is down from 2.0 in January 2023.
Is the US labor market too hot or too cold?
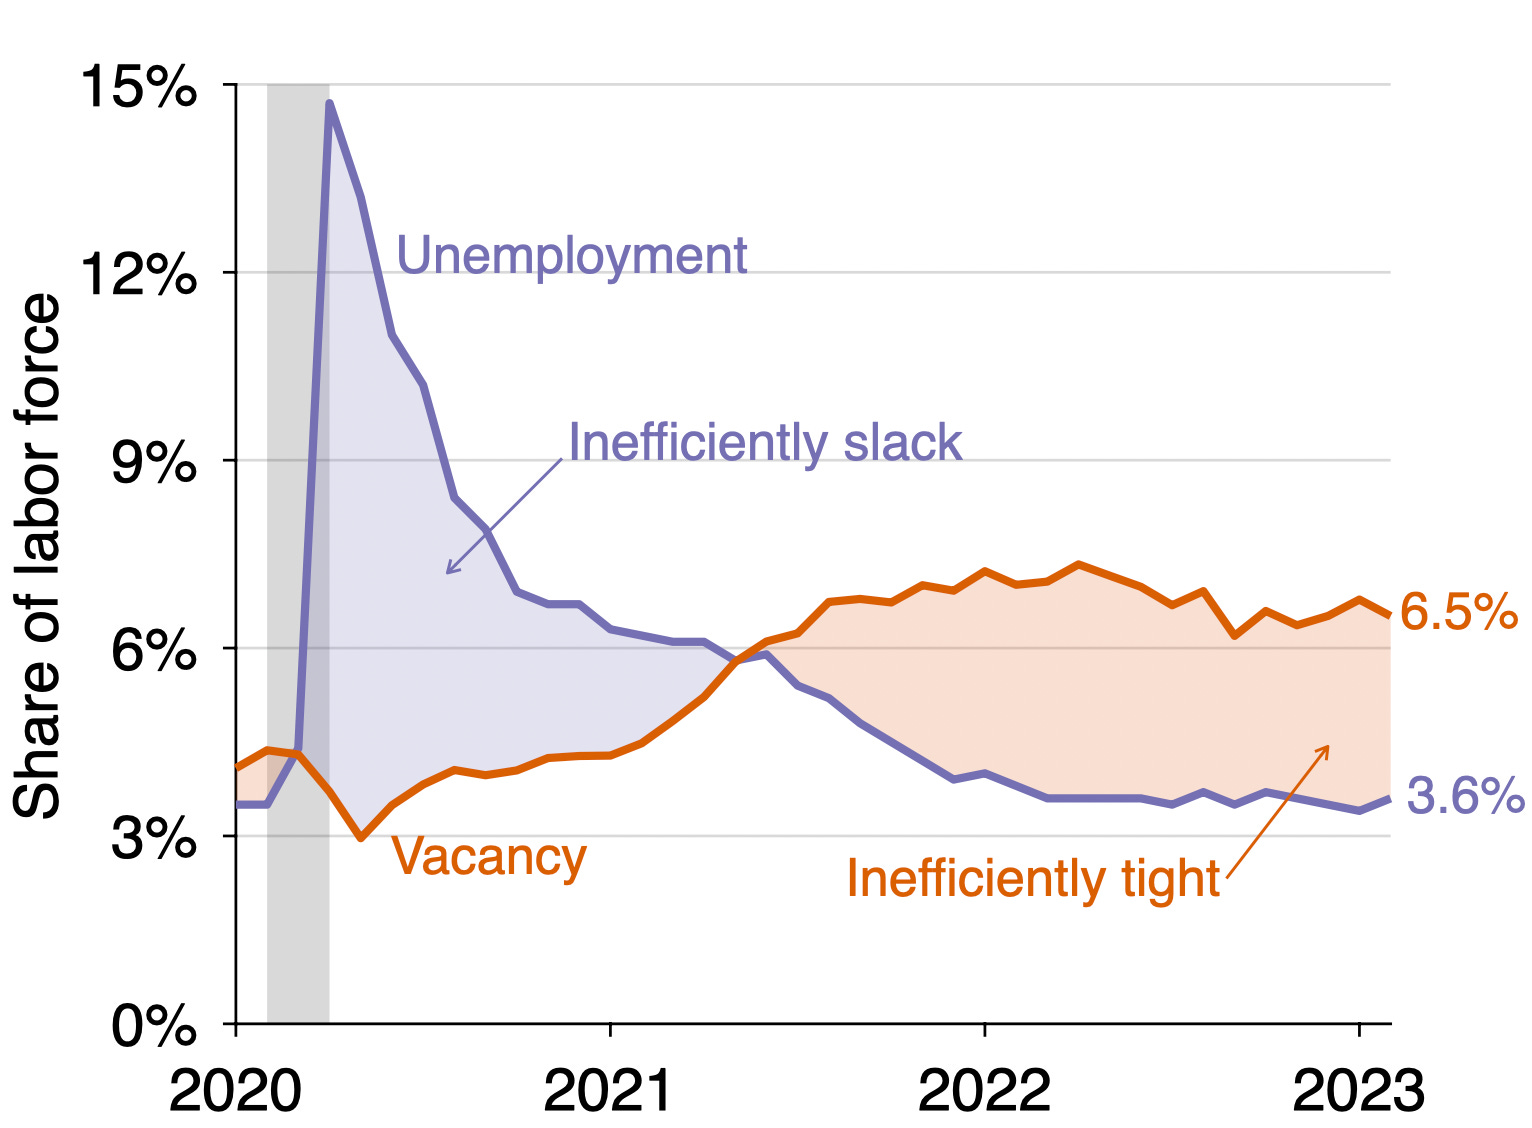
In a recent paper, Emmanuel Saez and I show that the labor market is efficient whenever u = v, inefficiently tight whenever u < v, and inefficiently slack whenever u > v.
Since the vacancy rate remains above the unemployment rate (6.5% > 3.6%), the US labor market remains inefficiently tight. The labor market has been inefficiently tight since May 2021, as illustrated in the graph below:
Another way to see that the labor market is inefficiently tight is that labor-market tightness v/u remains above unity (1.8 > 1). Labor-market tightness had been falling from May 2022, when it peaked at 2.0, to November 2022, when it reached 1.7. But labor-market tightness rose again in December 2022 and January 2023, reaching back a level of 2.0. So it looked like the labor market was picking up steam again at the end of 2022—despite the tightening of monetary policy that started in May 2022. This month, however, the labor market has resumed cooling.
How far is unemployment from its efficient level?
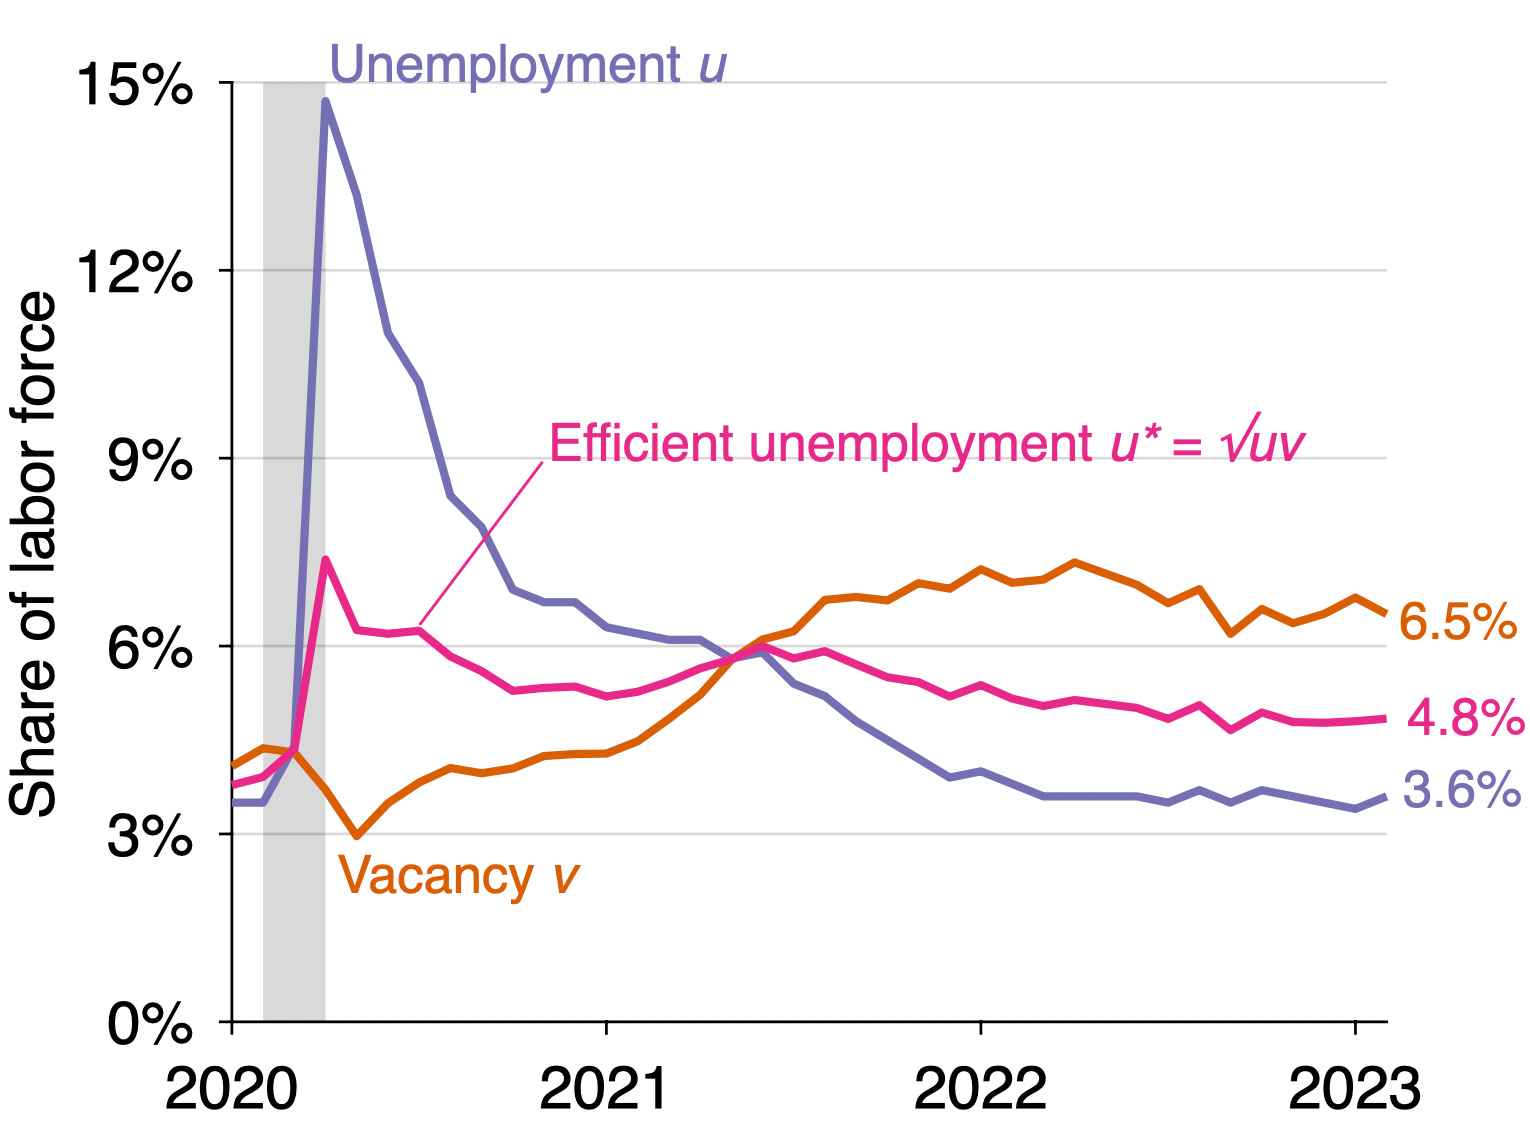
The labor market cooled and moved closer to efficiency in February 2023. To see how far from efficiency the labor market remains, let’s compute the efficient unemployment rate and unemployment gap in February 2023, using the formula from the same recent paper. These numbers tell us the current distance from efficiency:
Efficient unemployment rate: u* = √uv = 4.8%. This is the same as in January 2023.
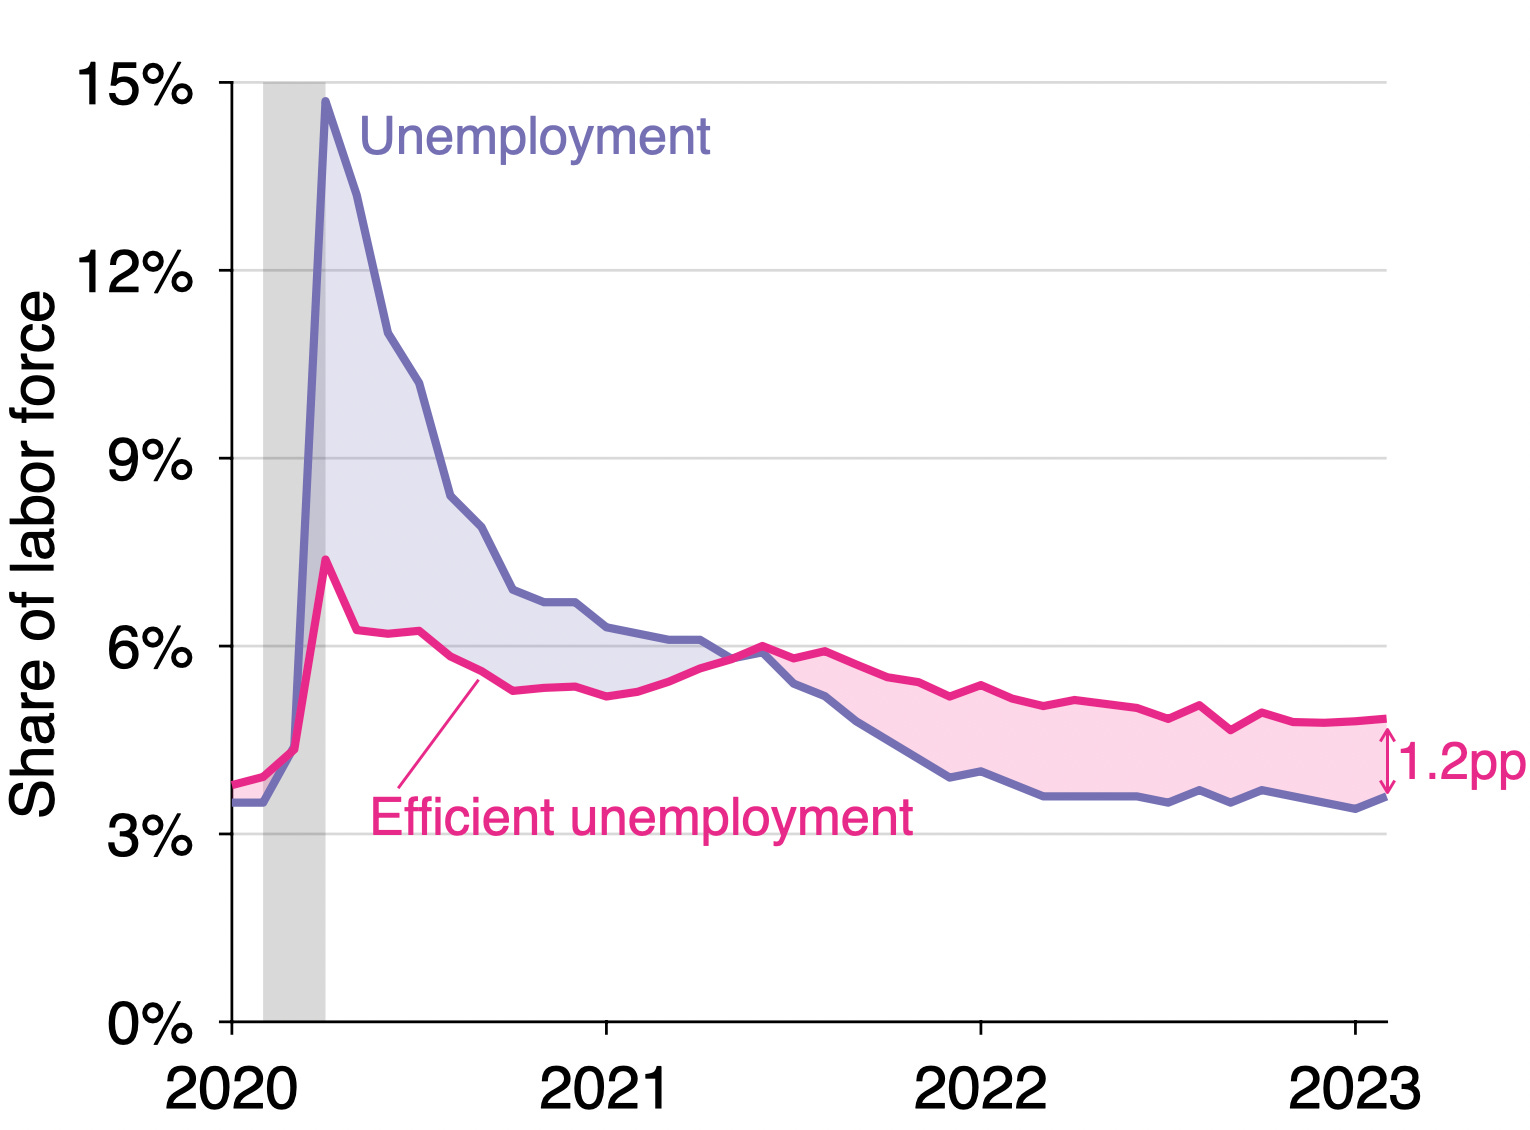
Unemployment gap: u – u* = –1.2pp. The gap has narrowed from –1.4pp in January 2023.
The construction of the efficient unemployment rate is illustrated below:
The evolution of the unemployment gap over the course of the pandemic is illustrated below:
What does this imply for monetary policy?
One of the mandates of monetary policy is to maintain the economy at full employment. If we interpret full employment as the socially desirable level of employment—which seems like a natural interpretation, and which also aligns theory with practice—then monetary policy should try to maintain the unemployment gap at zero.
The unemployment gap is currently negative, so monetary policy should tighten to cool aggregate demand and labor demand. A median estimate of the monetary multiplier is 0.5, which means that when the Fed raises the federal funds rate by 1 percentage point, the unemployment rate increases by 0.5 percentage points. The current unemployment gap is -1.2pp, so the Fed should raise the fed funds rate by 1.2/0.5 = 2.4pp to eliminate the gap.
This recommendation does not take into account inflation. This is purely to improve the allocation of labor (between producing, recruiting, and jobseeking) in the economy. The fact that inflation currently is also above the Fed’s target of 2% gives another reason to raise rates.
Of course there are complications. In particular, monetary policy takes time to affect the economy. It takes about 1.5 years for a change in the fed funds rate to fully take effect (see figure 2 in Coibion 2012). In the past year, the Fed has raised the fed funds rate from 0% to 4.5%. Only a fraction of that increase has taken effect. The rest might be enough to bring the unemployment rate to its efficient level.
What is happening to the Beveridge curve?
The Fed has has often said that it does not expect the unemployment rate to increase much once the economy has stabilized. At the same time, we have just seen that the goal of the Fed is to bring the unemployment rate to its efficient level, which currently is 4.8%. For such “soft landing” to occur, it must therefore be that the efficient unemployment rate falls down to 3.5% or 4%—so the unemployment gap can be closed without a higher unemployment rate.
The efficient unemployment rate was around 4% just before the pandemic, so this might seem like a reasonable expectation. However, the efficient unemployment rate is determined by the location of the Beveridge curve, and the curve is not where it was before the pandemic. The curve has shifted dramatically outward during the pandemic:
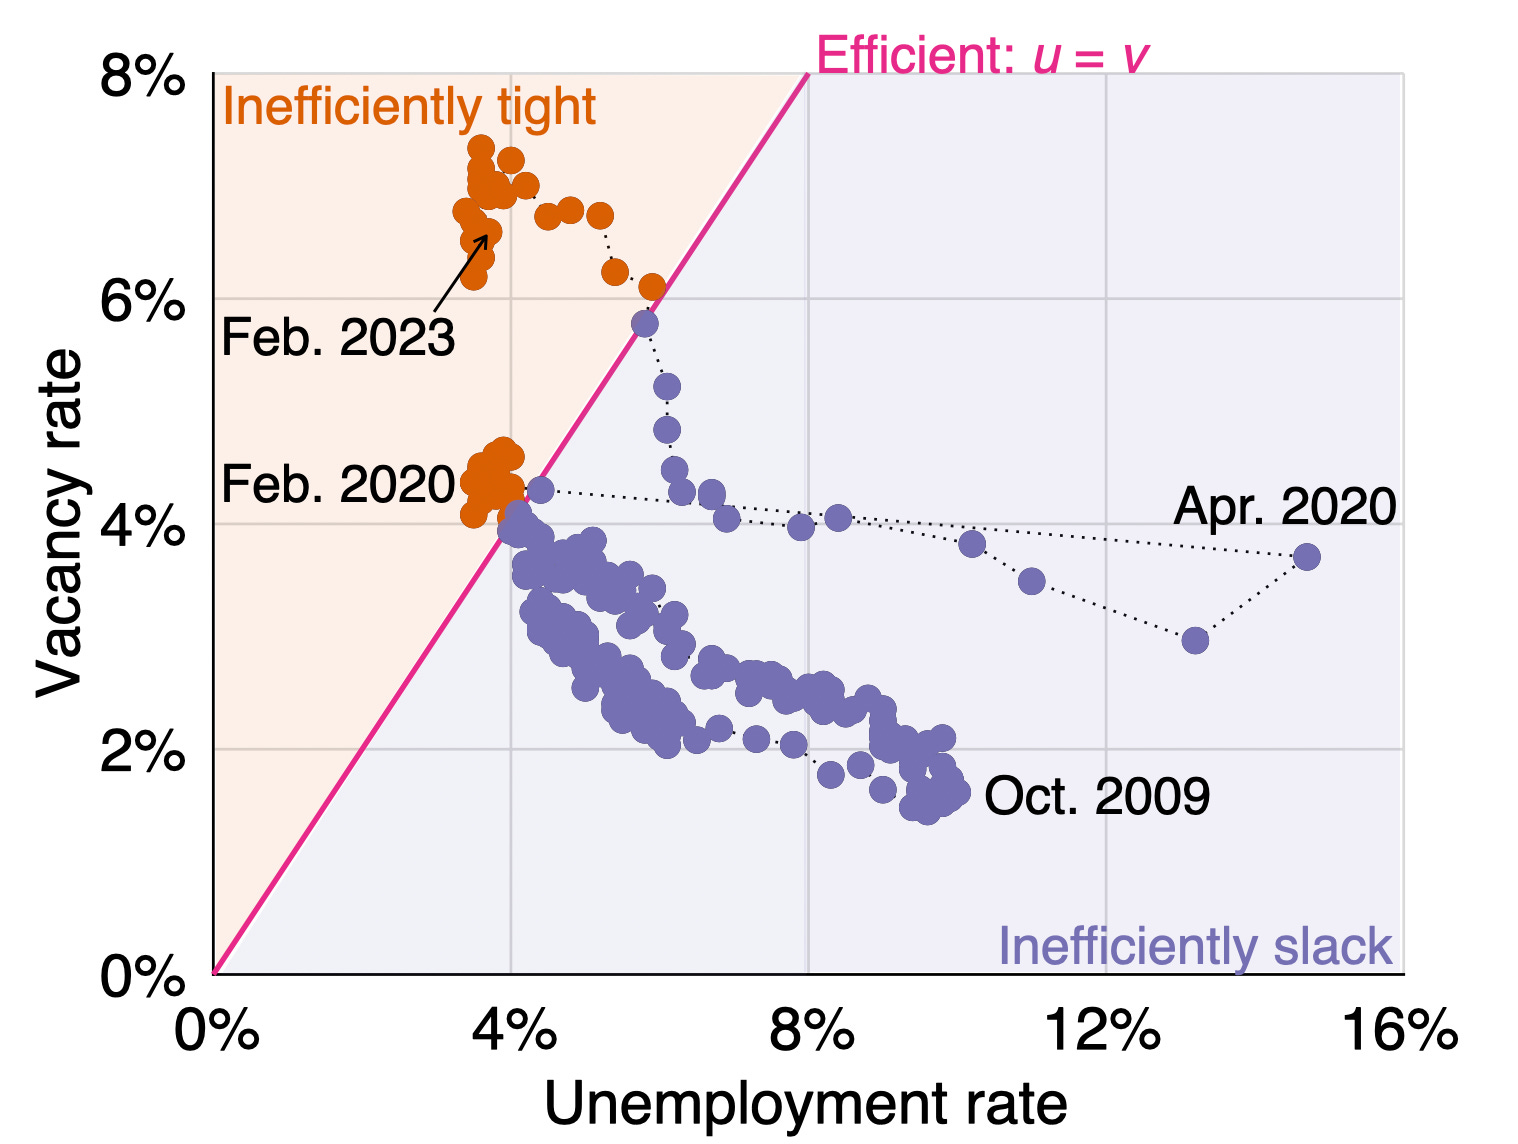
For the efficient unemployment rate to come down to its pre-pandemic level, the Beveridge curve will have to shift back inward to its pre-pandemic location. Otherwise the efficient unemployment rate will remain at its current level, and the unemployment rate will have to increase to close the unemployment gap. The curve remains much further outward than before the pandemic, as the above graph shows, and there is currently no sign that the curve will come back to its pre-pandemic level. But let’s keep an eye on the curve in the next few months to see whether a soft landing will materialize.
The JOLTS is a firm survey conducted on the last business day of the month. The JOLTS release is dated January 2023, but because vacancies are measured on the last business day of January, I assign these numbers to February 2023.
The CPS is a household survey conducted on the Sunday–Saturday week including the 12th of the month.