September Labor-Market Update
The US labor market tightened slightly in September, with labor-market tightness rebounding to 1.16. The recession probability fell to 36%.
Main message: US labor-market tightness rose slightly to 1.16 in September 2024. So US the labor market is still inefficiently tight. The probability that the US economy is in recession fell down to 36%.
The US labor-market data for September 2024 just came out. This post uses the latest numbers on vacant jobs and unemployed workers from the Bureau of Labor Statistics to compute labor-market tightness, full-employment rate of unemployment (FERU), unemployment gap, and recession probability.
New developments
The US labor-market statistics for September 2024 are as follows:
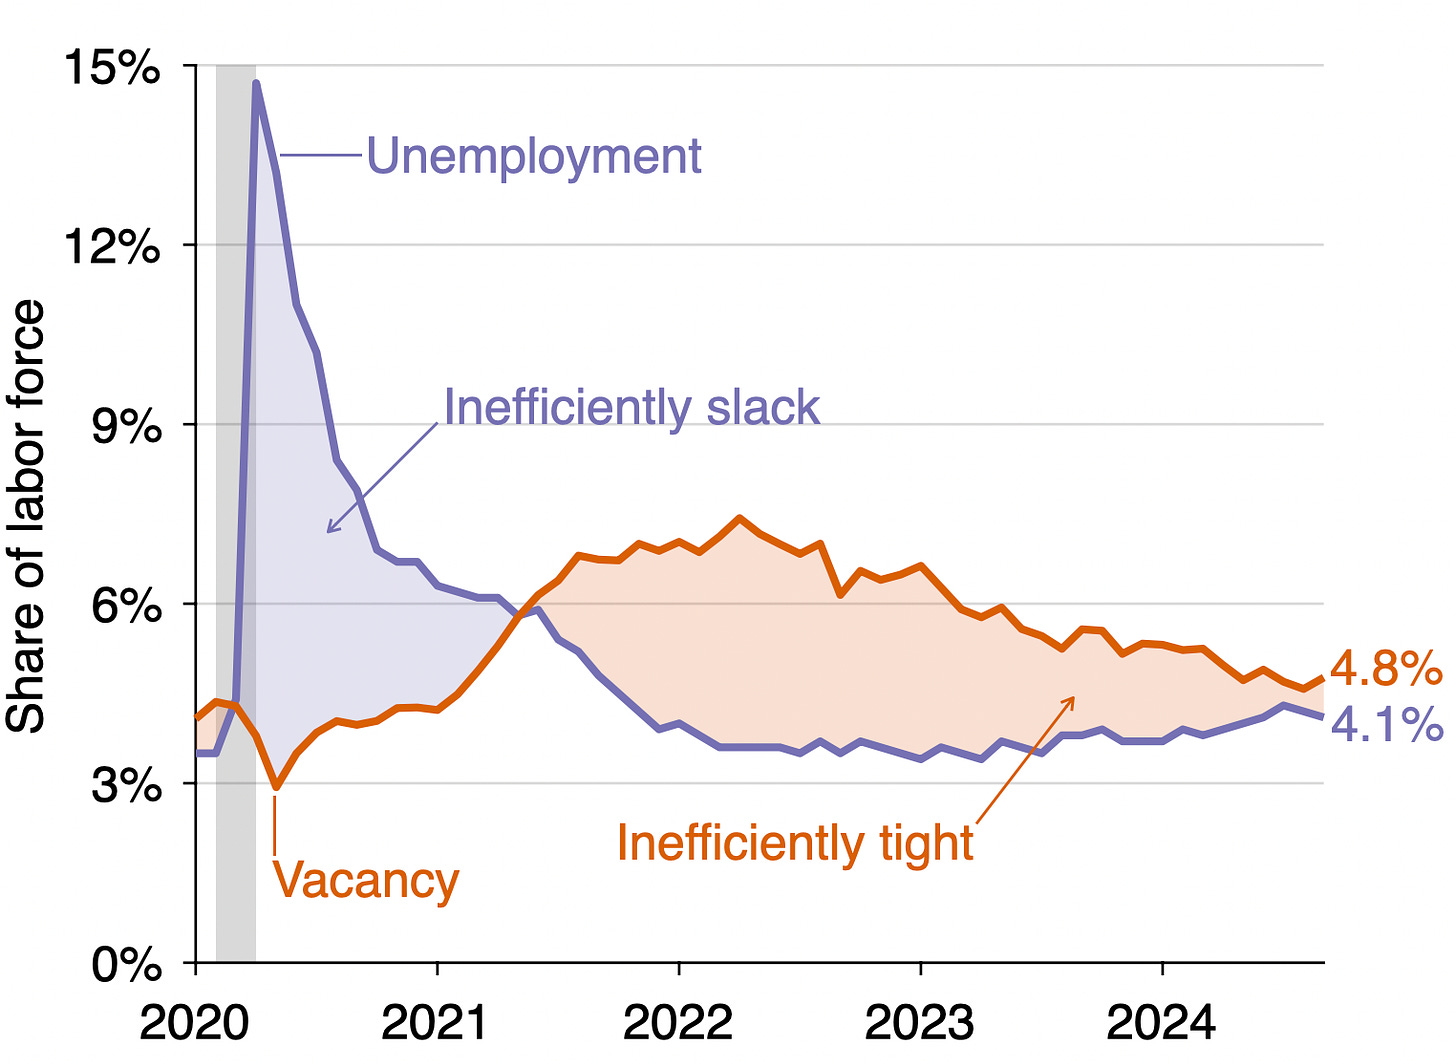
Unemployment rate: u = 4.1%. This is down from 4.2% in August.
Vacancy rate: v = 4.8%. This is up from 4.6% in August.
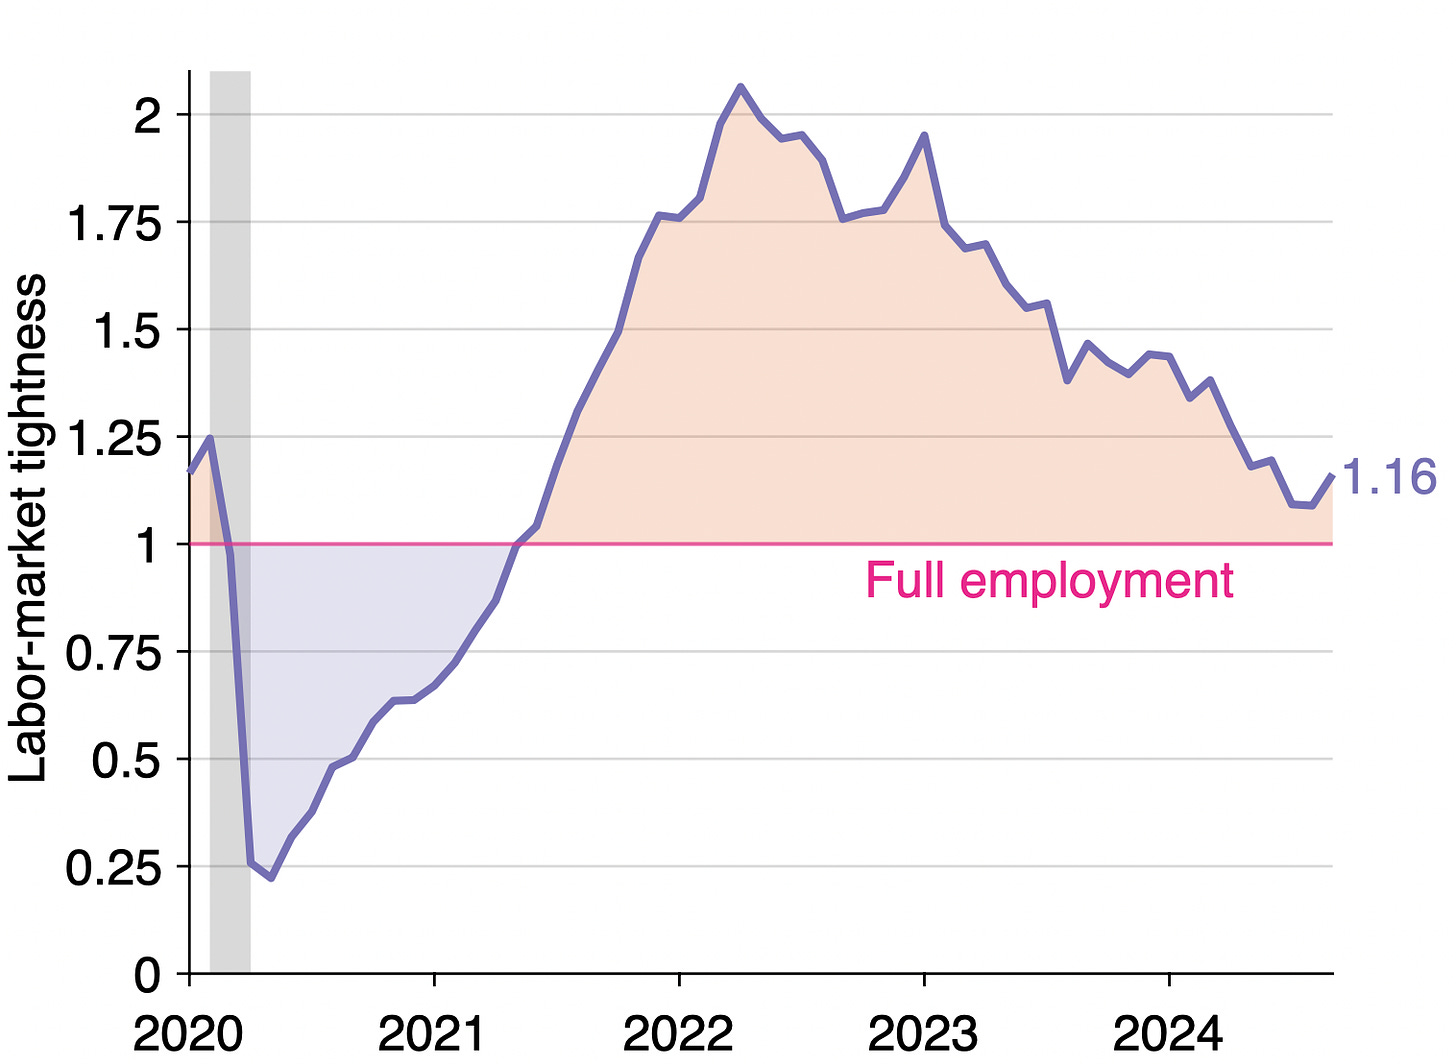
Labor-market tightness: v/u = 4.8/4.1 = 1.16. This is up from 1.09 in August.
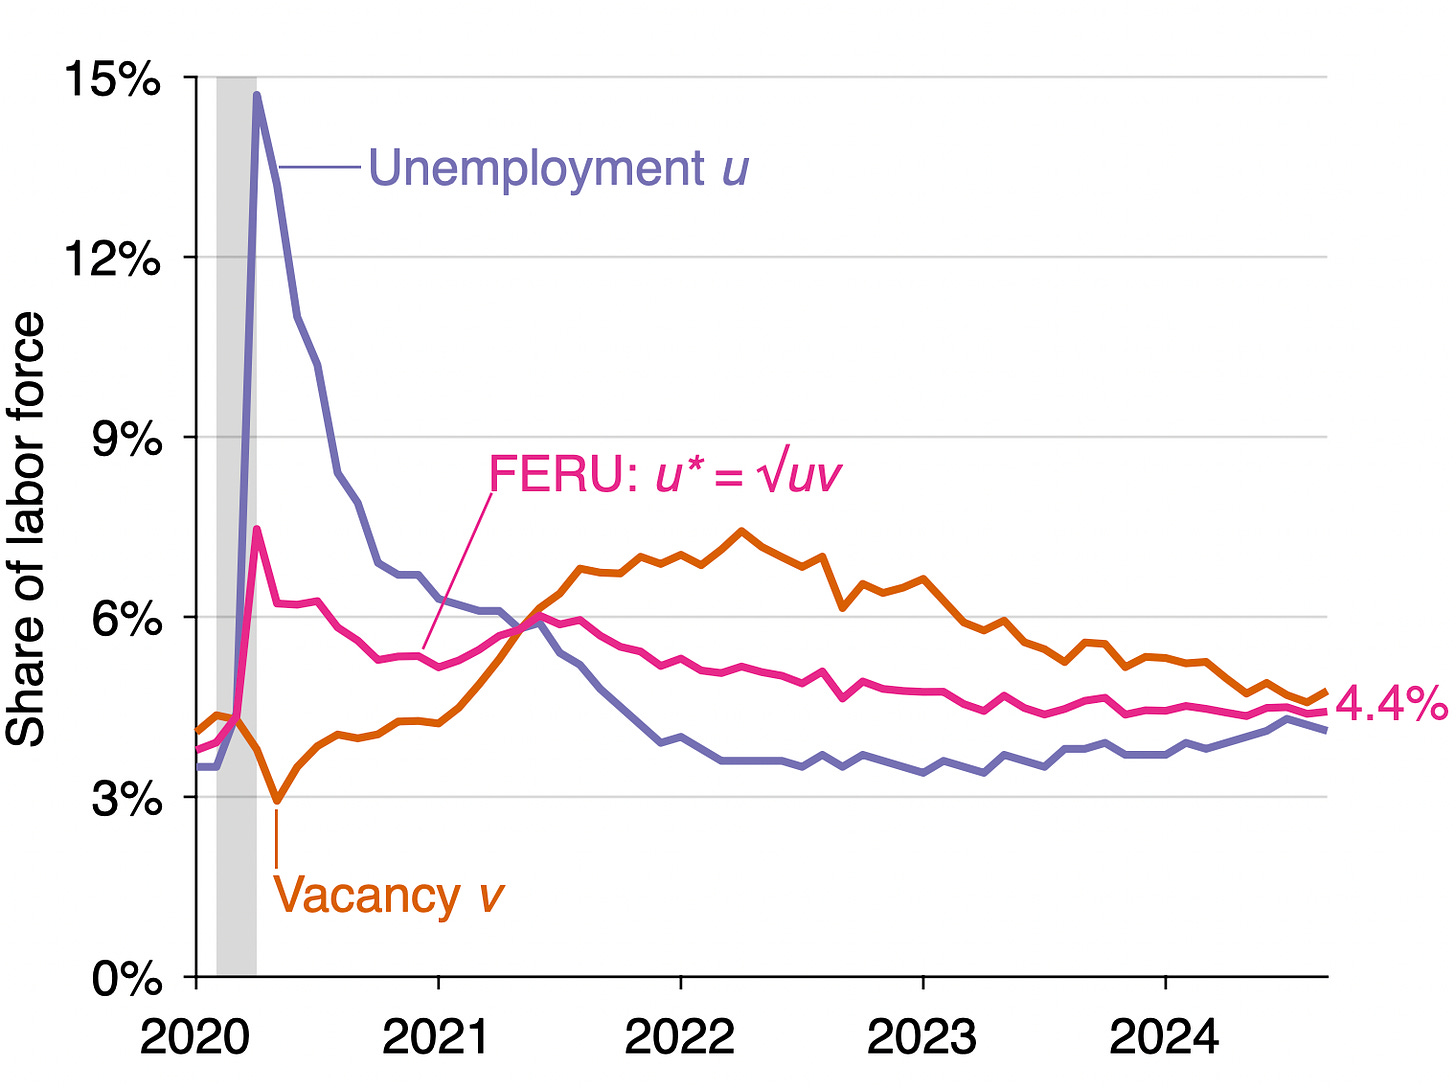
FERU: u* = √uv = √(0.041 × 0.048) = 4.4%. This is the same as in August.
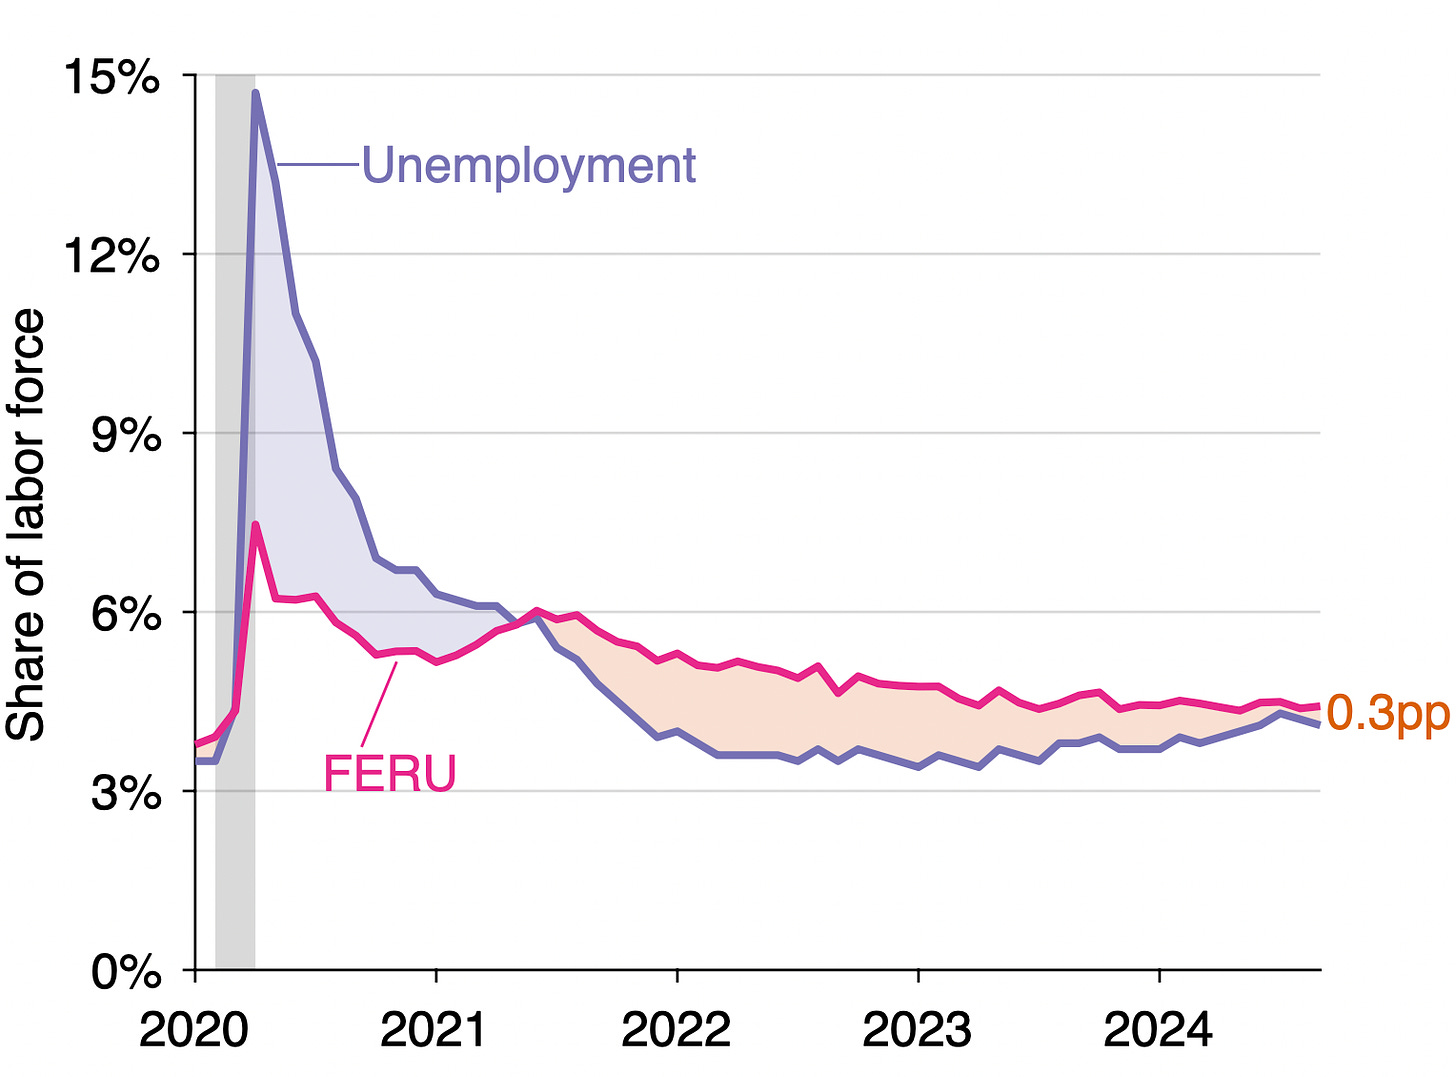
Unemployment gap: u – u* = 0.041 – 0.044 = –0.3pp. The gap widened from -0.02pp in August.
Recession indicator = 0.48pp. This is down from 0.54pp in August.
Recession probability = (0.48-0.3)/(0.8-0.3) = 36%. This is down from 48% in August.
Background for readers just joining us
The FERU formula u* = √uv is derived in a paper with Emmanuel Saez that we have recently revised. The revised version includes additional theoretical results. For instance we show that the formula u* = √uv continues to be valid even if workers move in and out of the labor force, and even if the participation decision depends on the state of the labor market. The paper will come out in the Fall 2024 issue of the Brookings Papers on Economic Activity.1
The formula implies that the labor market is at full employment when there are as many unemployed workers as vacant jobs (u = v); inefficiently tight when there are fewer unemployed workers than vacant jobs (u < v); and inefficiently slack when there are more unemployed workers than vacant jobs (u > v). Data and code for the paper are available on GitHub.
The recession indicator and recession probability are developed in new work with Emmanuel. The recession indicator combines data on job vacancies and unemployment. The indicator is the minimum of the Sahm indicator—the difference between the 3-month trailing average of the unemployment rate and its minimum over the past 12 months—and a similar indicator constructed with the vacancy rate—the difference between the 3-month trailing average of the vacancy rate and its maximum over the past 12 months. When the indicator reaches 0.3pp, a recession may have started; when the indicator reaches 0.8pp, a recession has started for sure. The data and code used in the note are also available on GitHub.
Is the US labor market too tight or too slack now?
Coming back to the September 2024 situation, we see that the vacancy rate is above the unemployment rate (4.8% > 4.1%), so the US labor market remains inefficiently tight. The labor market has been inefficiently tight since May 2021:
We can also see that the US labor market is inefficiently tight by looking at labor-market tightness v/u. Tightness remains above unity (1.16 > 1), which signals that the labor market is inefficiently hot. However, the overall trend is that the labor market is approaching full employment:
Labor-market tightness has also now fallen below its pre-pandemic level (it hovered around 1.2 in 2019 and early 2020). So the post-pandemic overheating seems to have now dissipated.
How far is unemployment from the FERU?
Since the labor market is inefficiently tight, the actual unemployment rate remains below the FERU. The FERU remained the same as last month.The graph below illustrates the construction of the FERU:
The FERU is 0.3 percentage point above the actual unemployment rate (u = 4.1%, u* = 4.4%). This negative unemployment gap is another manifestation of an inefficiently tight labor market. Below is the evolution of the unemployment gap over the course of the pandemic. The unemployment gap has been negative (u* > u) since the middle of 2021:
Given how much the labor market cooled, have we entered a recession?
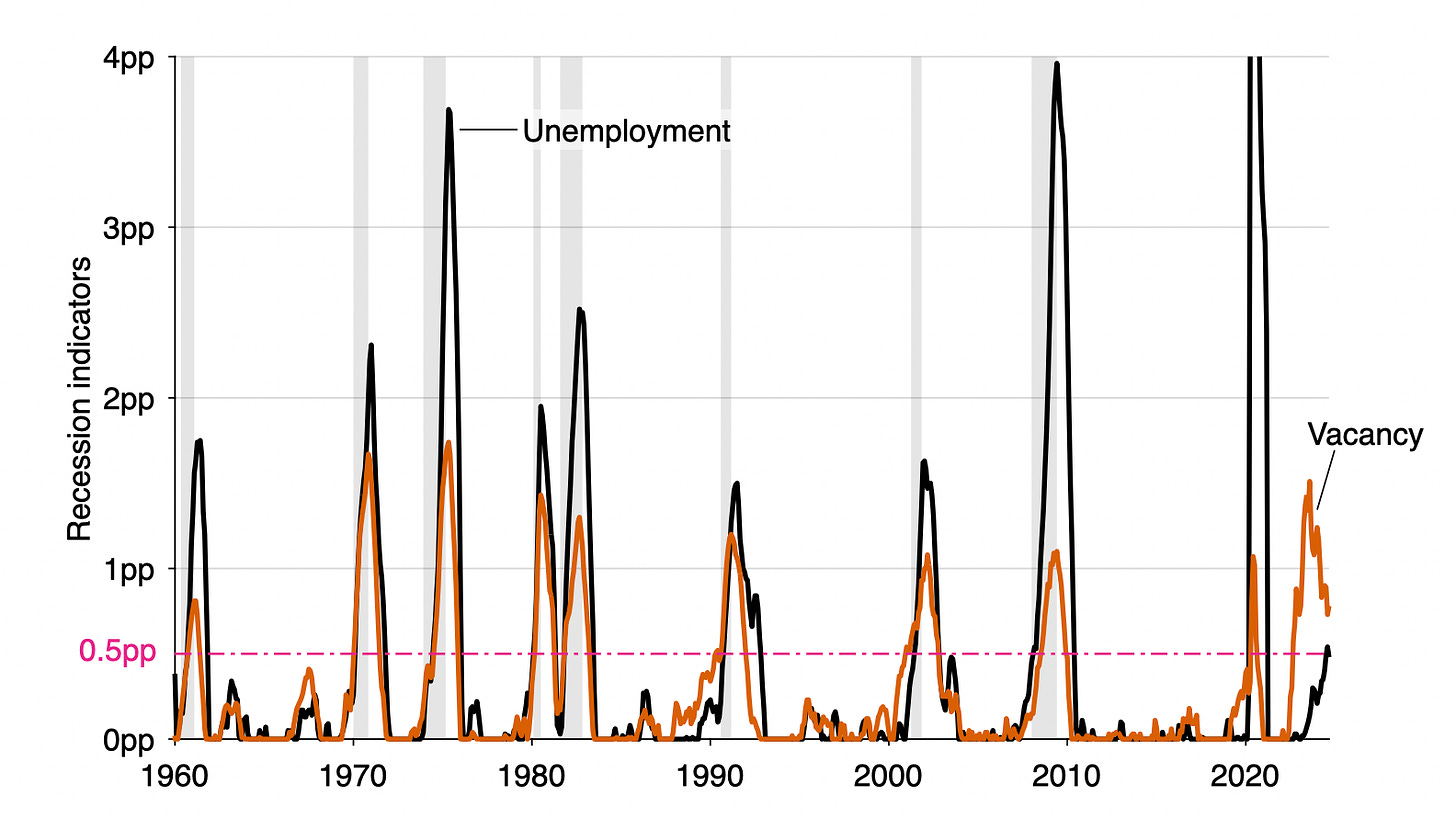
Our indicator is the minimum of the Sahm indicator, which is built from the unemployment rate, and a similar indicator built with the vacancy rate. Below is the standard Sahm indicator (black line) and the threshold of 0.5pp that is used in the Sahm rule. The Sahm indicator is the difference between the 3-month trailing average of the unemployment rate (plotted above) and its minimum over the past 12 months. The Sahm rule says that a recession might have started whenever the unemployment indicator crosses the threshold of 0.5pp. The Sahm rule was triggered for the first time in August (the indicator reached 0.54pp > 0.5pp), but it was untriggered this month (the indicator is now 0.48pp < 0.5pp). So the message from the Sahm rule is muddled:
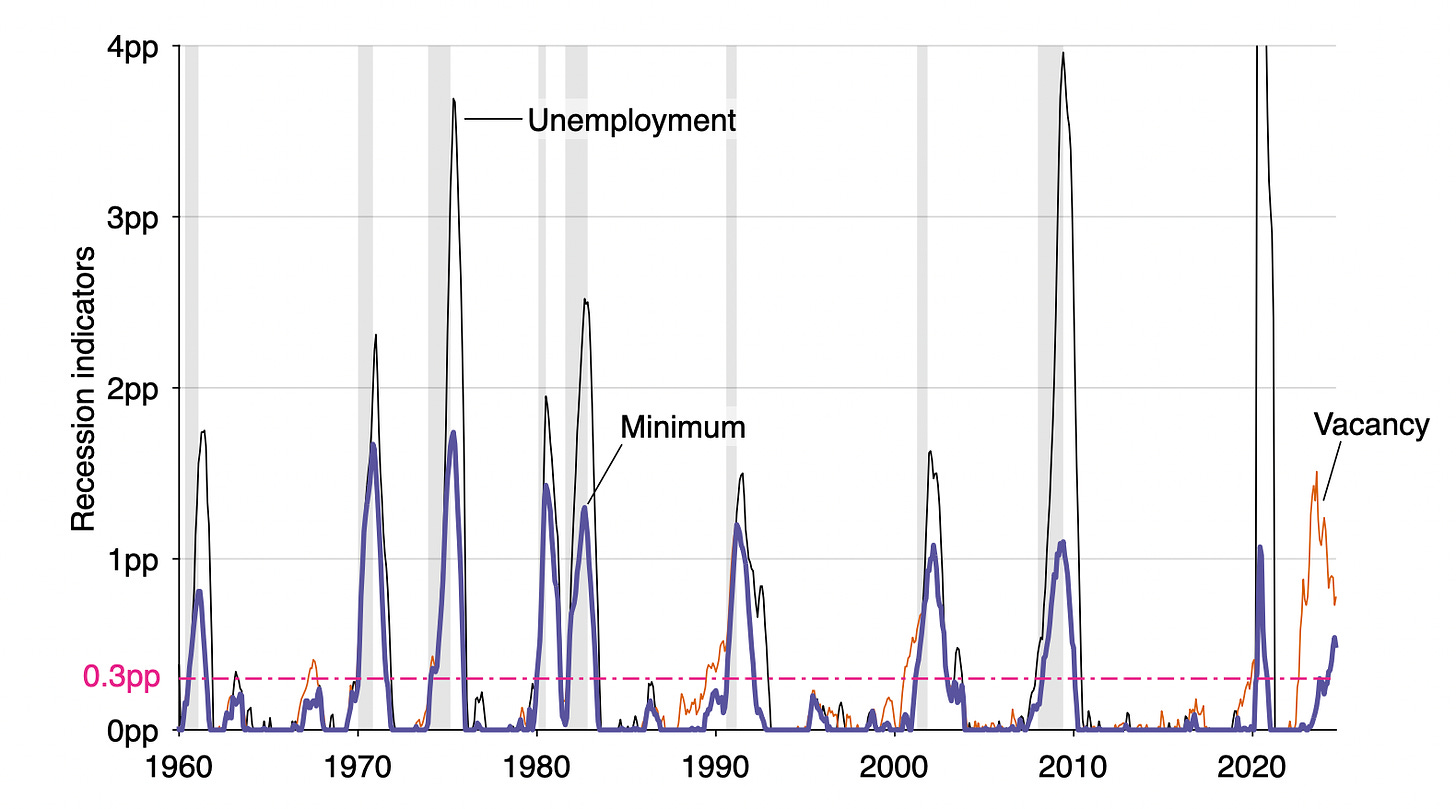
But we can also construct the same type of indicator with the vacancy rate (orange line above). Indeed, job vacancies start falling quickly at the onset of recessions, when unemployment starts rising. Requiring that both rise gives a more accurate and—maybe counterintuitively—more rapid recession signal. Here is the indicator that we build, the minimum of the unemployment and vacancy indicators:
Because this minimum indicator is less noisy than either the unemployment or the vacancy indicator, we can lower the recession threshold from 0.5pp to 0.3pp and detect recessions faster. On average between 1960 and 2022, our new recession rule, based on the minimum indicator, detects US recessions 0.8 month after they have started, while the Sahm rule detects them 2.1 months after their start.
Our minimum indicator reached 0.3pp between March and April 2024, so the recession might have started then. The current value of the minimum indicator is 0.48pp, so well above the recession threshold of 0.3pp.
What is the probability that we are now in recession?
A one-sided recession rule such as the Sahm rule tells us whether a recession might have started. To know what is the likelihood that a recession has started, we propose a two-sided recession rule.
The bottom threshold is the lowest value that generates no false positives over 1960–2022. A false positive is when the rule predicts a recession that does not materialize. This bottom threshold is 0.3pp.
The top threshold is the highest value that generates no false negatives over 1960–2022. A false negative is when the rule does not catch an actual recession. This top threshold is 0.8pp.
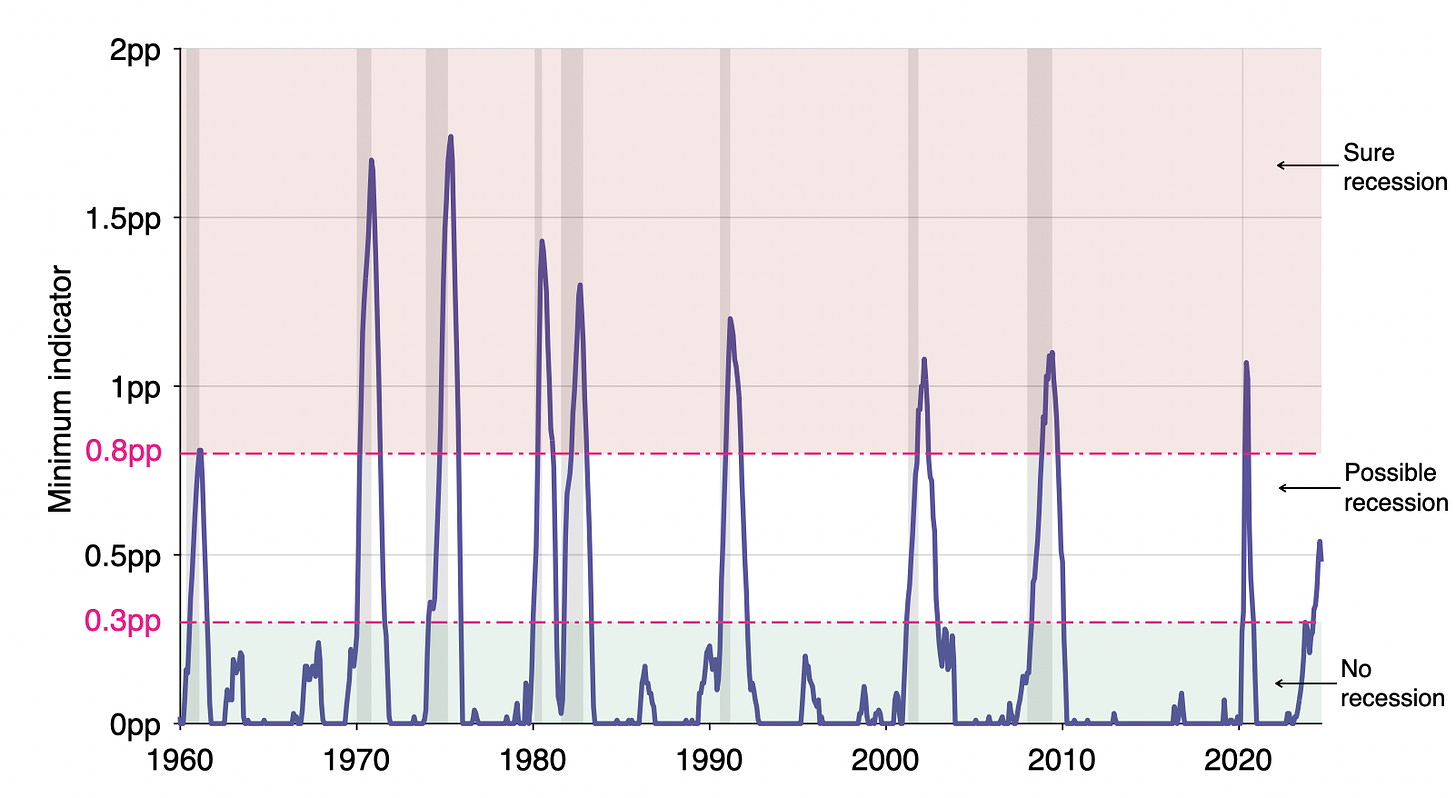
The rule therefore says the following. When the minimum indicator is below 0.3pp, we cannot say that a recession has started. When the minimum indicator is between 0.3pp and 0.8pp, the recession might have started. And when the minimum indicator is above 0.8pp, the recession has started for sure. The two-sided rule operates as follows:
With September 2024 data, the minimum indicator is at 0.48pp, so the probability that the US economy is now in recession is (0.48-0.3)/(0.8-0.3) = 36%.
This probability captures the fact that we do not know exactly what is the threshold between a recession and a non-recession. From historical data, we learn that the true threshold is somewhere between 0.3pp and 0.8pp, because any threshold between 0.3pp and 0.8pp produces no false positives and no false negatives, so it perfectly separates recessions from non-recessions. The recession probability captures the share of the threshold range that has been covered.
Brookings has produced a nice nontechnical summary of the paper, which comes with a graph summarizing all the results in one place.


I like the data that you track!
I remain unconvinced by the formula. It implies, if I understand it correctly that the "cost" of excess tightness is lost income of workers searching instead of actually being employed. That seems right as far as it goes, but does it take account of the value of the search yielding a better fit, higher income?
As for the recession probability, why should we need to know if we are or are not "in" recession? [I agree that people DO so there is nothing wrong with your meeting a market demand. :)]