


October Labor-Market Update
US labor-market numbers for October are in. Labor-market tightness remains around 1.5—still above its efficient value of 1. The Beveridge curve shifted slightly outwards.
The US labor-market numbers for October 2023 just came out. This post uses the latest numbers on vacant jobs and unemployed workers from the Bureau of Labor Statistics to compute three key statistics:
Labor-market tightness
Efficient unemployment rate
Unemployment gap
The US labor market is broadly in the same situation as in September. So the labor market remains inefficiently tight. The Beveridge curve shifted very slightly outwards, slightly raising the efficient unemployment rate.
New developments
The US labor-market statistics for October 2023 are as follows:
Unemployment rate: u = 3.9%. This is up from 3.8% in September.
Vacancy rate: v = 5.7%. This is the same as in September.
Labor-market tightness: v/u = 5.7/3.9 = 1.5. This is the same as in September.
Efficient unemployment rate: u* = √uv = √(0.039 × 0.057) = 4.7%. This is up from 4.6% in September.
Unemployment gap: u – u* = 0.039 – 0.047 = –0.8pp. The gap is the same as in September.
Is the US labor market is too tight or too slack?
Since the vacancy rate is above the unemployment rate (5.7% > 3.9%), the US labor market remains inefficiently tight. This means that the labor market is above full employment: the labor market is so hot that an excessive amount of labor is devoted to recruiting and hiring instead of producing.1 In fact, the labor market has been inefficiently tight since May 2021, as illustrated below:
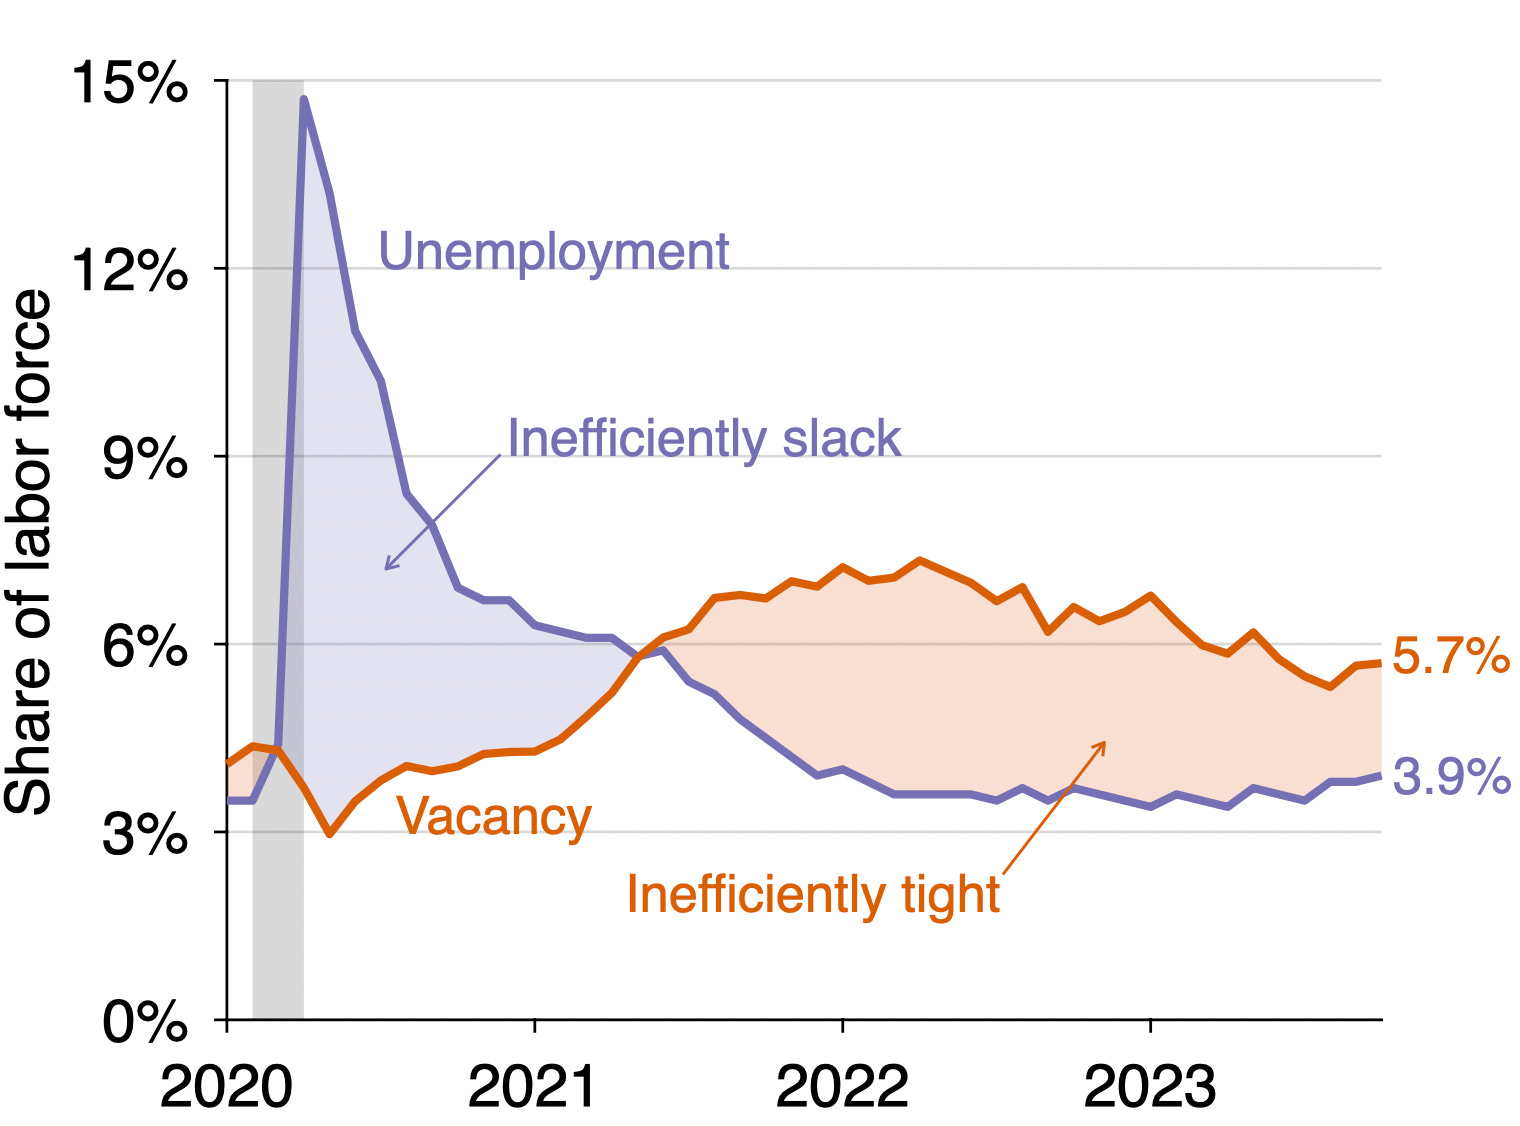
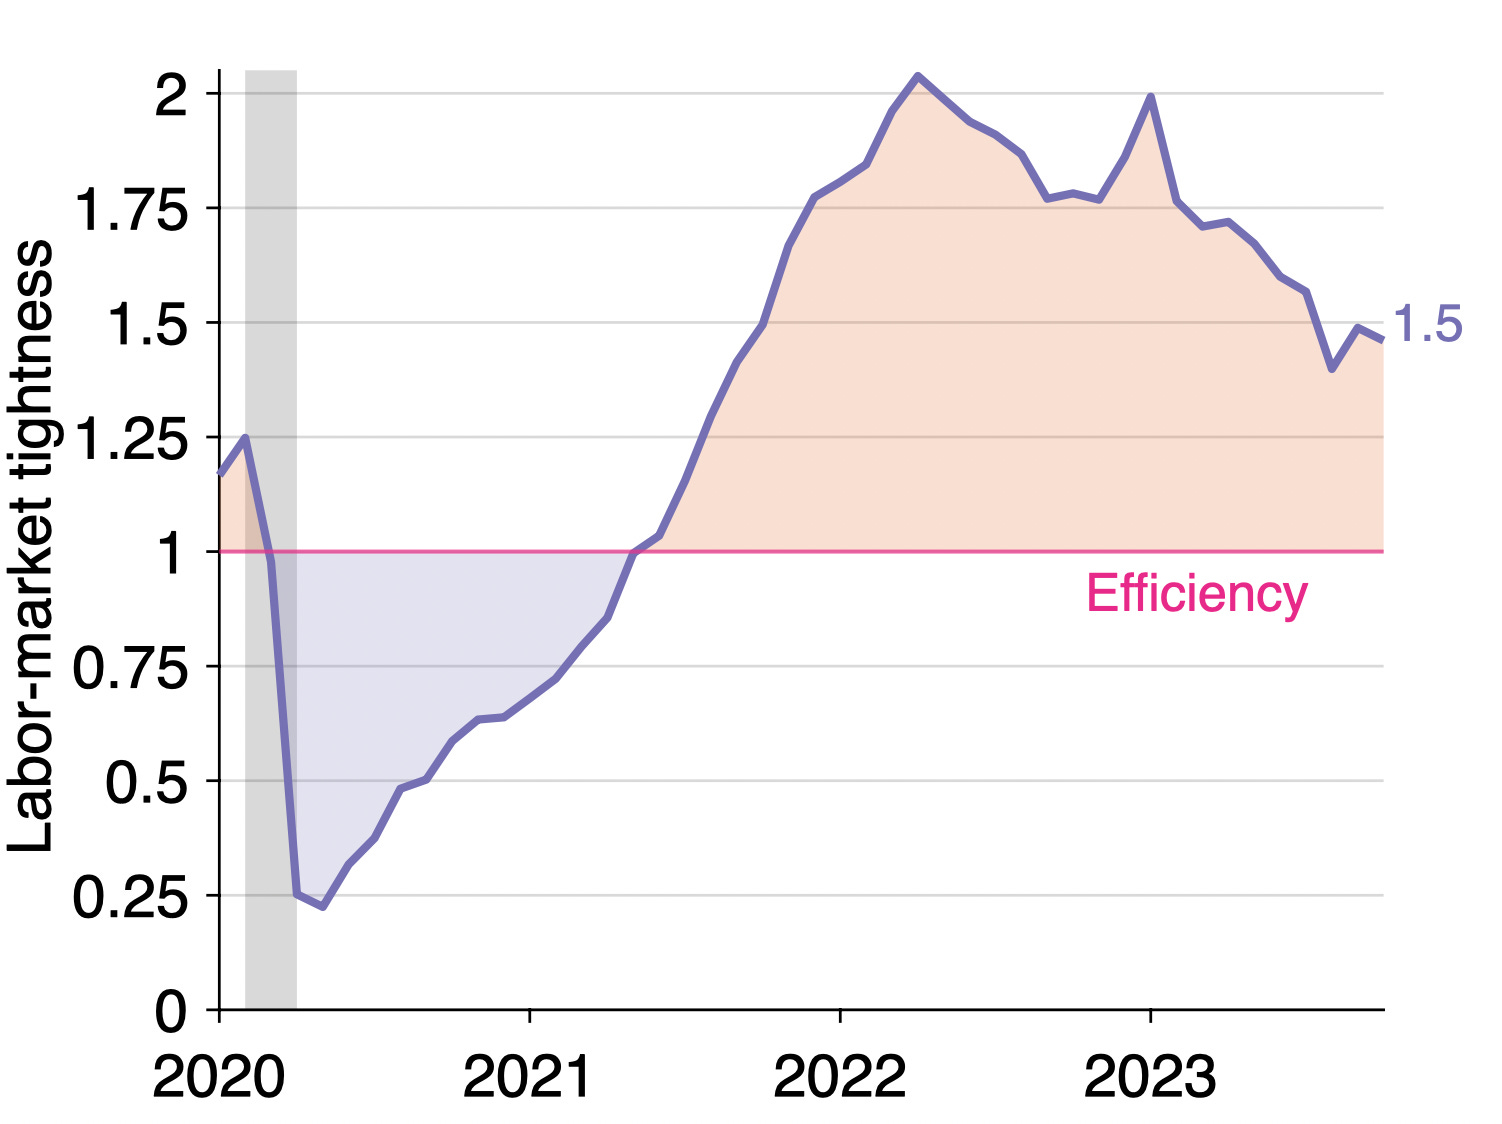
We can also see that the US labor market is inefficiently tight by looking at labor-market tightness v/u, which remains above unity (1.5 > 1):
How far is unemployment from its efficient rate?
Tightness remains above 1, so the labor market is still inefficiently tight. This means that the actual unemployment rate remains below the efficient unemployment rate. The graph below illustrates the construction of the efficient unemployment rate:
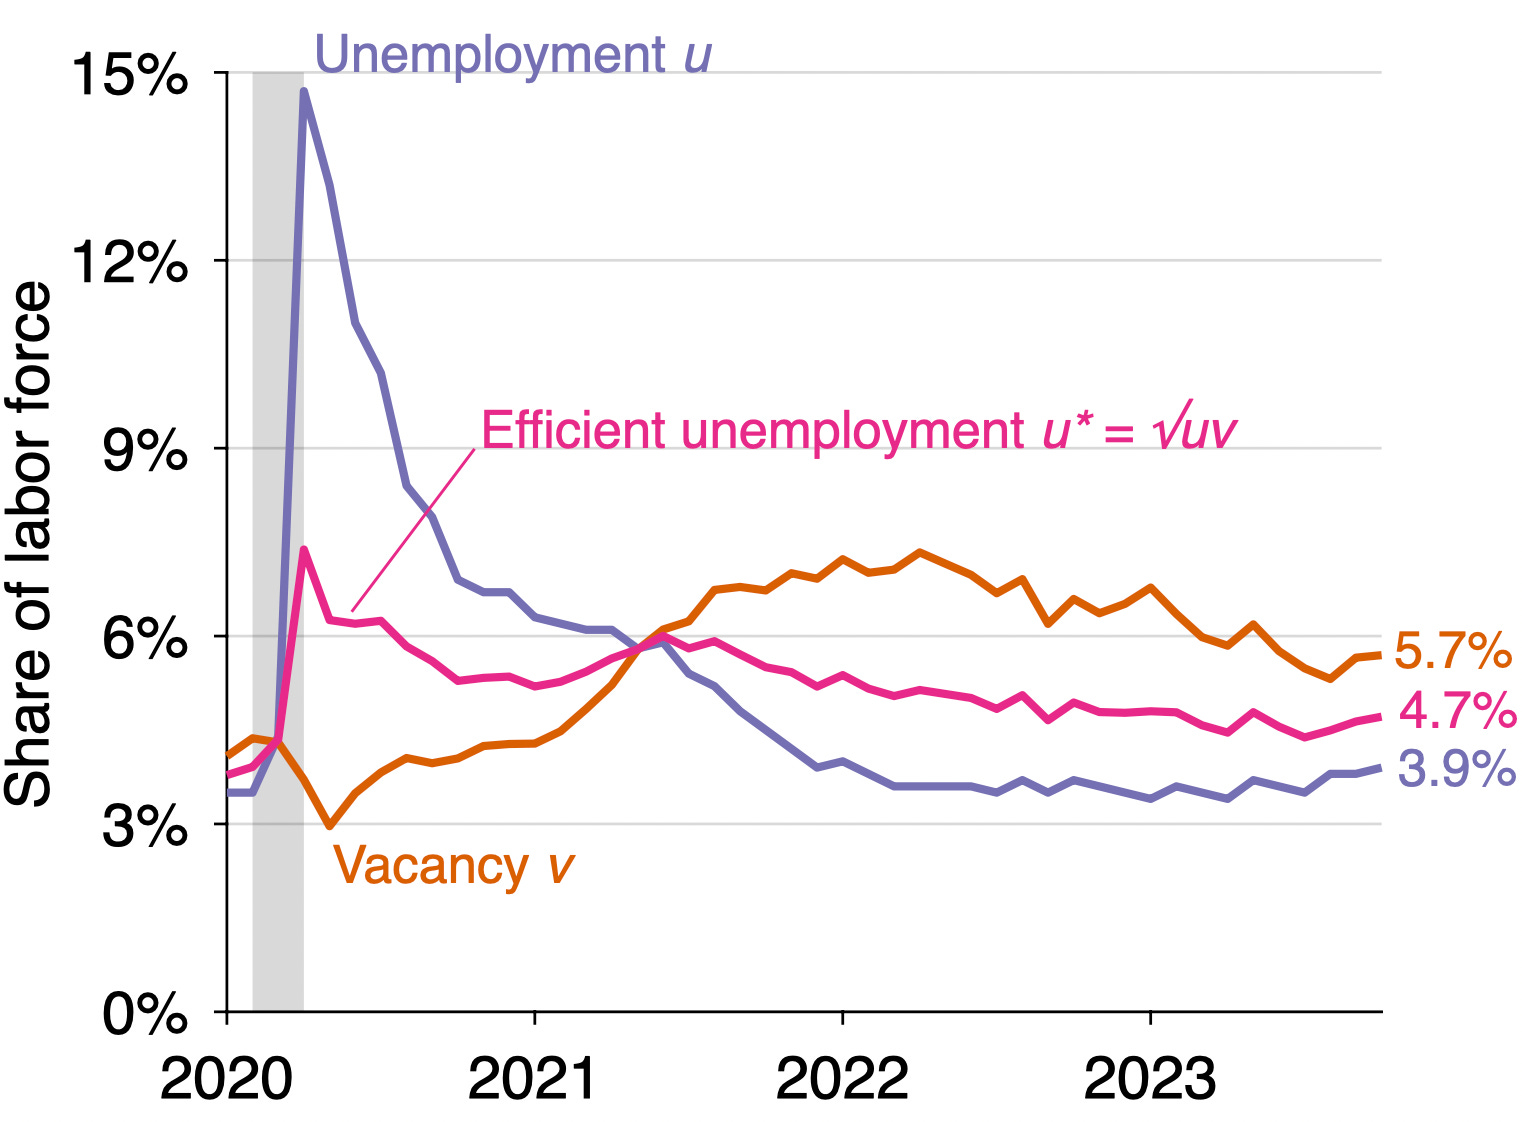
In October the efficient unemployment rate is 0.8 percentage point above the actual unemployment rate (u* = 4.7% while u = 3.9%). This negative unemployment gap is another manifestation of an inefficiently tight labor market.
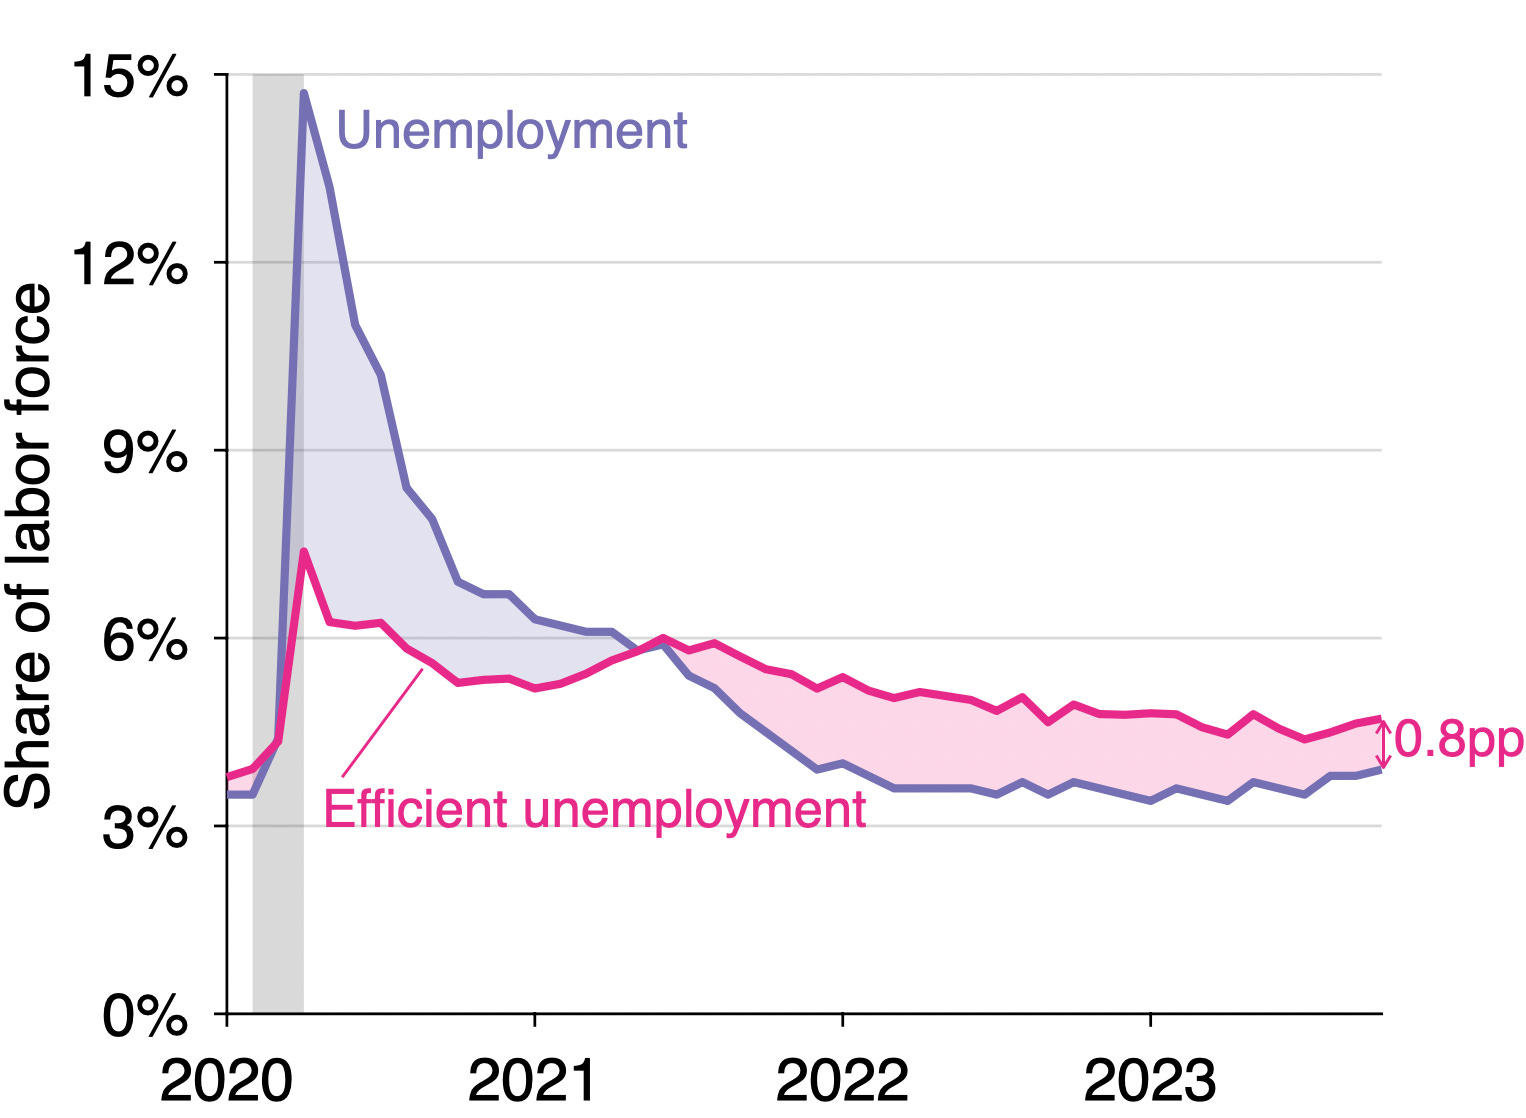
Below is the evolution of the unemployment gap over the course of the pandemic. The unemployment gap has been negative (u* > u) since the middle of 2021:
The efficient unemployment rate u* indicates the unemployment rate consistent with full employment. Since one of the mandates of the Federal Reserve is to maintain the economy at full employment, u* is a good target for the Fed. When the actual unemployment rate reaches u*, the Fed knows that it has satisfied its employment mandate. Currently unemployment is below u*, so the labor market needs to cool some more to reach full employment.
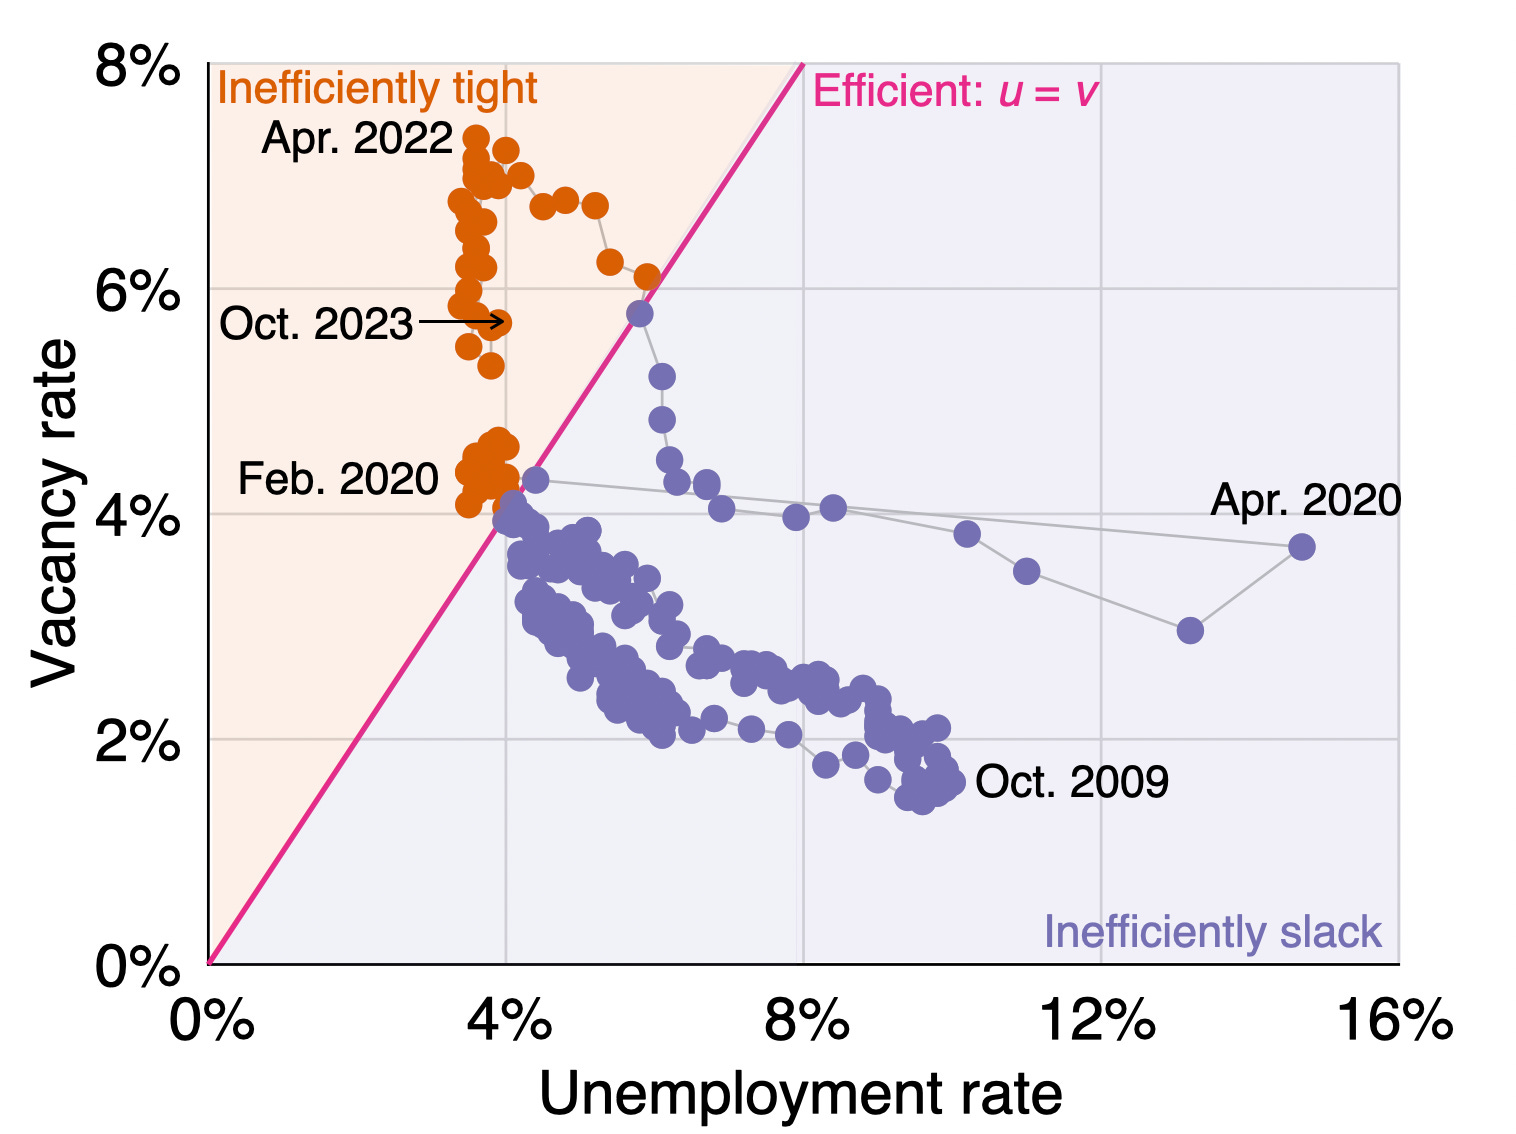
What is happening to the Beveridge curve?
The reason why the efficient unemployment rate slightly rose in October is that the Beveridge curve shifted out slightly. The Beveridge curve shifted dramatically outward at the onset of the pandemic. Since April 2022, however, the Beveridge curve has been slowly shifting back inward to its pre-pandemic location. Such shifts do not occur very often, but the curve is currently well between its pre-pandemic and pandemic locations.
In September and October, however, the curve shifted back outward. Below is the current location of the US labor market in the Beveridge diagram:
Background for readers just joining us: data
The number of vacant jobs is measured by the Job Openings and Labor Turnover Survey (JOLTS). The number of unemployed workers is measured by the Current Population Survey (CPS). The CPS also reports the number of labor-force participants. These numbers then give unemployment and vacancy rates:
Unemployment rate = # unemployed workers / # labor-force participants
Vacancy rate = # vacant jobs / # labor-force participants
Background for readers just joining us: methodology
The formula u* = √uv for the efficient unemployment rate is derived in a recent paper that Emmanuel Saez and I wrote. The paper shows that under simple but realistic assumptions, the efficient unemployment rate is the geometric average of the unemployment and vacancy rates—that is, u* = √uv.
An implication of this formula is that the labor market is efficient whenever there are as many unemployed workers as vacant jobs (u = v); inefficiently tight whenever there are fewer unemployed workers than vacant jobs (u < v); and inefficiently slack whenever there are more unemployed workers than vacant jobs (u > v). This criterion can also be formulated using labor-market tightness v/u.
Figure code and template
The figures in this post are updated versions of those in the paper.
The code and data to produce the figures in the paper is available on GitHub: https://github.com/pmichaillat/squareroot-uv/. This repository might be helpful to reproduce the analysis or apply the analysis to other labor markets.
The MATLAB template used to plot macroeconomic data is also available on GitHub: https://github.com/pmichaillat/matlab-figures/. The template produces basic time series and scatter plots, such as those in this post.
Note that this definition of efficiency and full employment has nothing to do with inflation: it is only about the appropriate allocation of resources on the labor market.