

The US Labor Market Continues to Cool Slowly Towards Efficiency
The US Labor Market Continues to Cool Slowly Towards Efficiency
Analyzing the November 2022 numbers released by the US Bureau of Labor Statistics.
This week the US Bureau of Labor Statistics (BLS) released the numbers of vacant jobs and unemployed workers in November 2022 on the US labor market. In this note we briefly review these numbers and use them to compute the efficient unemployment rate and unemployment gap.
How are the numbers measured?
The number of vacant jobs is measured by the Job Openings and Labor Turnover Survey (JOLTS). The JOLTS is a firm survey conducted on the last business day of the month. The JOLTS release is dated October 2022, but because vacancies are measured on the last business day of October, we ascribe these numbers to November 2022.
The number of unemployed workers is measured by the Current Population Survey (CPS). The CPS is a household survey conducted on the Sunday–Saturday week including the 12th of the month.
The CPS also reports the number of labor-force participants. This number is used to compute the unemployment and vacancy rates:
Unemployment rate = unemployed workers / labor-force participants
Vacancy rate = vacant jobs / labor-force participants
What are this month’s numbers?
The numbers for November 2022 are the following:
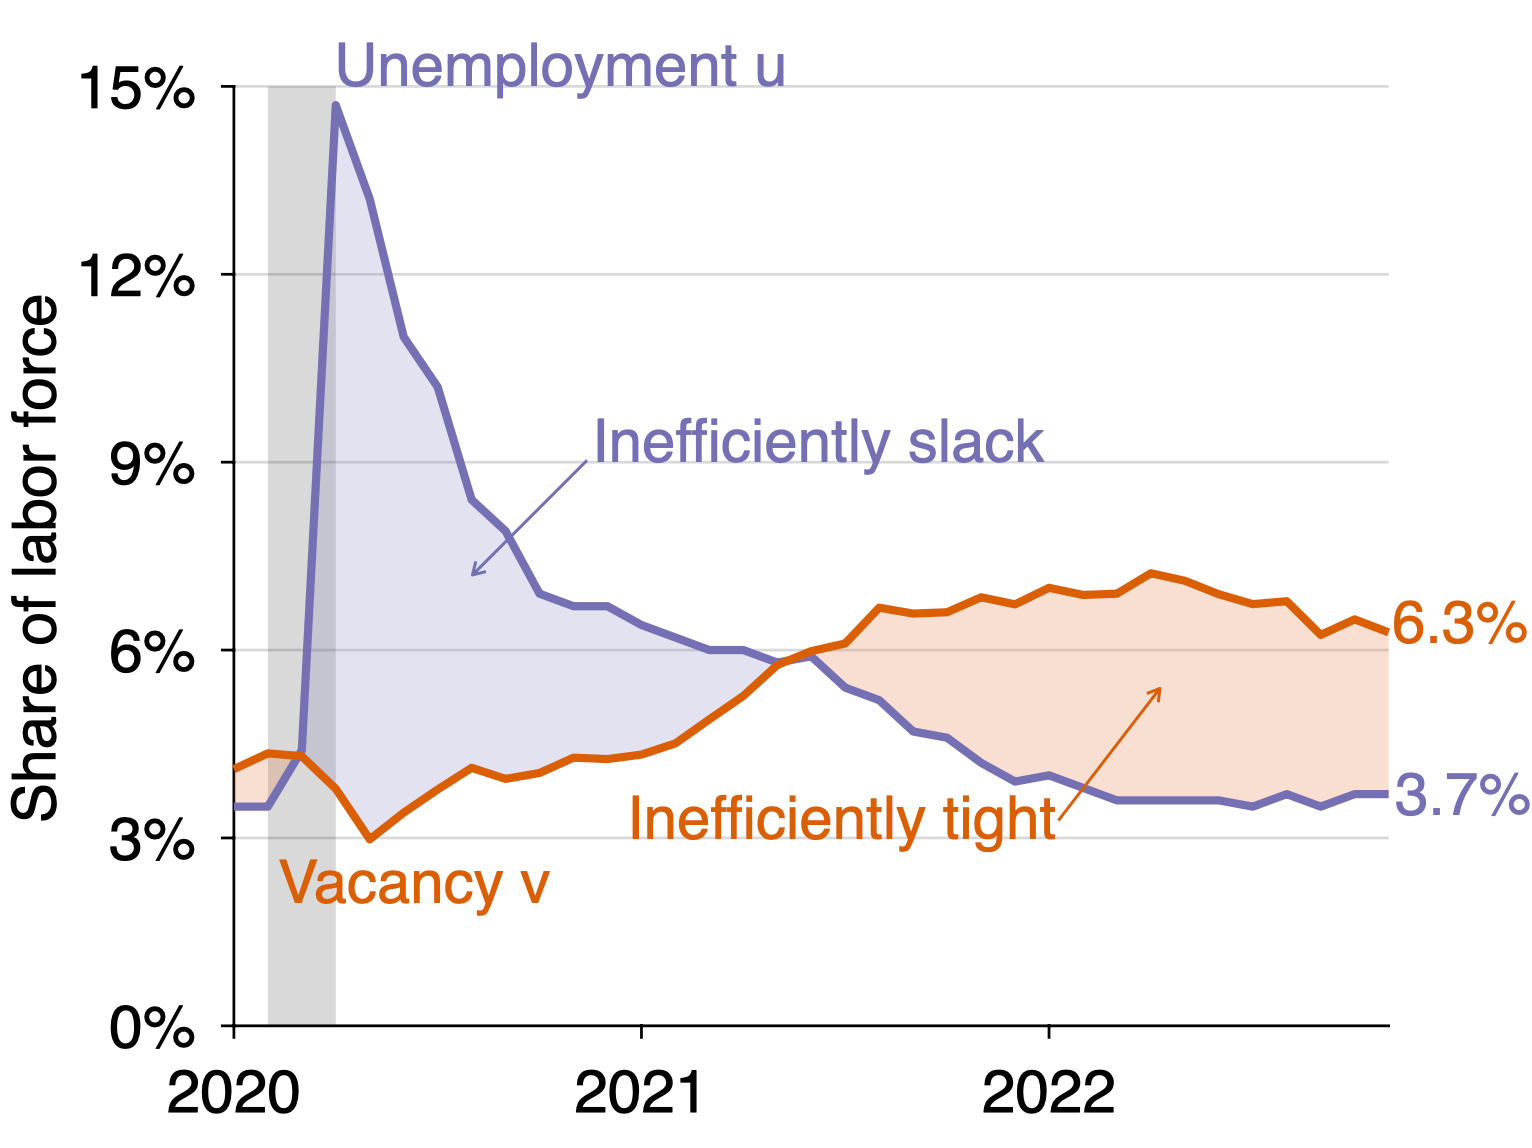
Unemployment rate: u = 3.7%. This is the same as in October 2022.
Vacancy rate: v = 6.3%. This is down from 6.5% in October 2022.
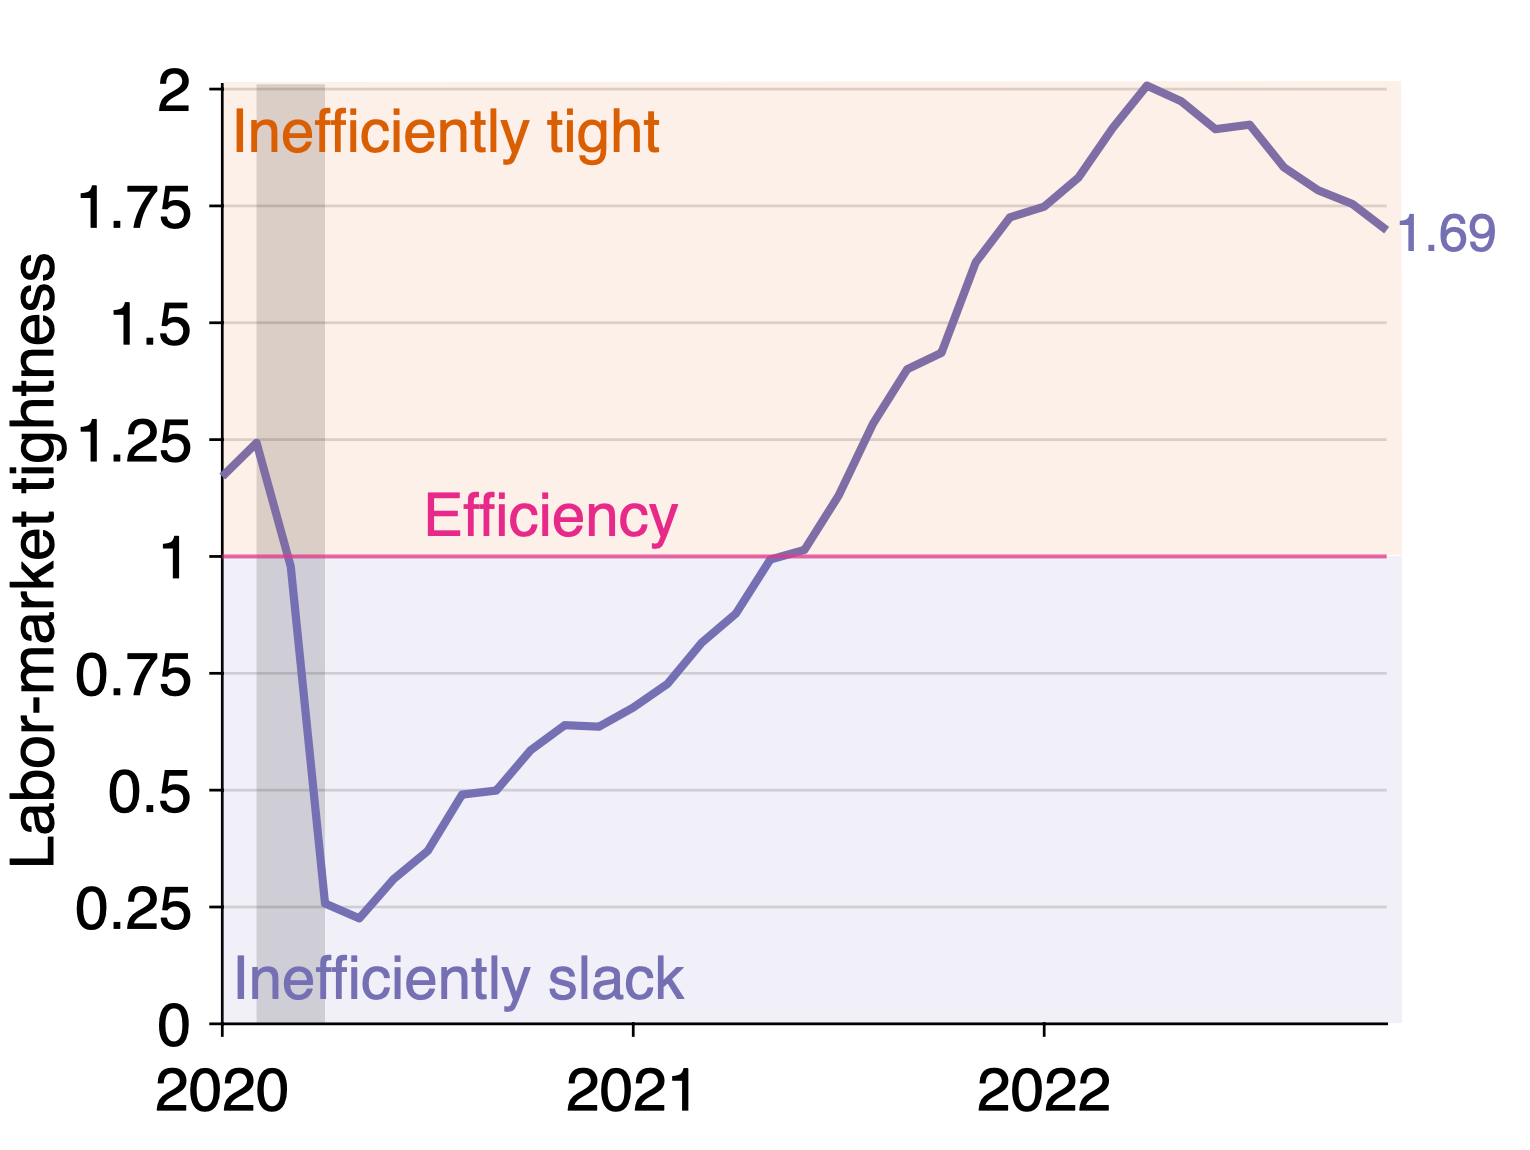
Labor-market tightness: v/u = 1.69. This is down from 1.75 in October 2022.
Is the labor market too hot or too cold?
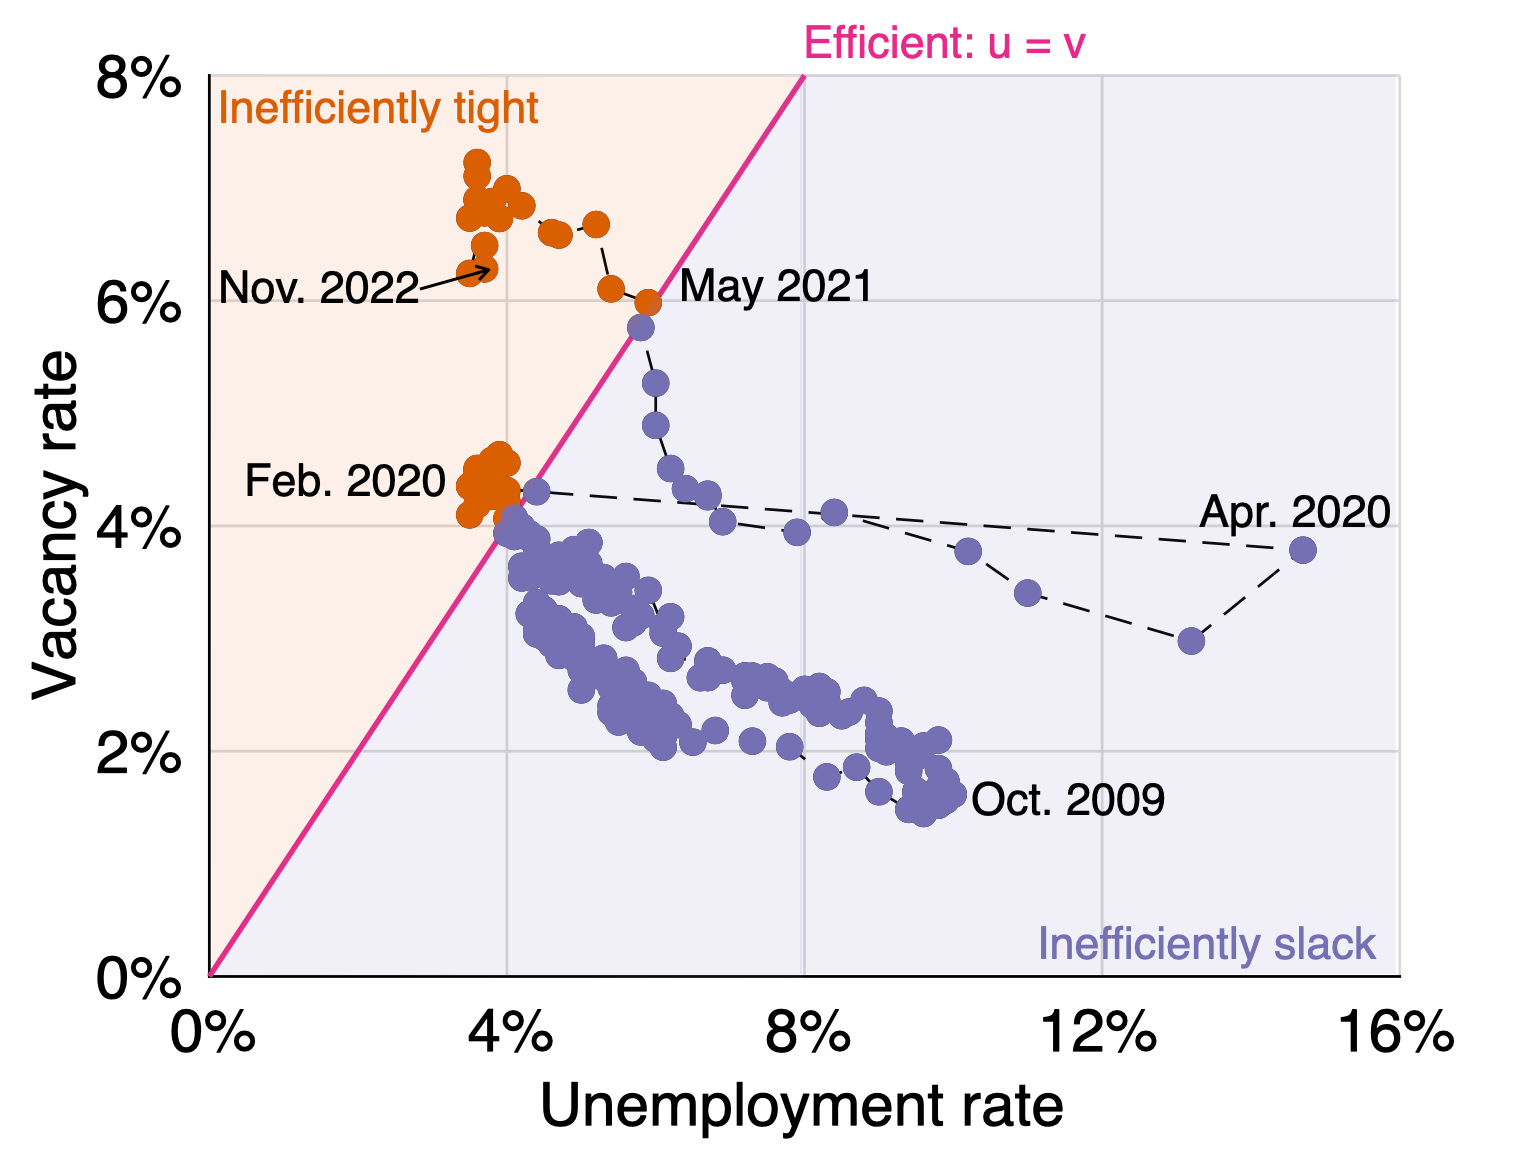
The vacancy rate remains above the unemployment rate (6.3% > 3.7%), so the US labor market remains inefficiently tight. The labor market has been inefficiently tight since May 2021, as illustrated in the graph below:
Another way to see that the labor market is inefficiently tight is that the labor-market tightness remains above unity (1.69 > 1). However, labor-market tightness has been falling since May 2022—when it peaked at 2.0. The labor market has therefore passed its peak tightness and is slowly cooling towards efficiency:
How far is the unemployment rate from its efficient level?
Since the labor market is not at efficiency, we compute the efficient unemployment rate and unemployment gap to assess the distance that remains to cover to reach efficiency:
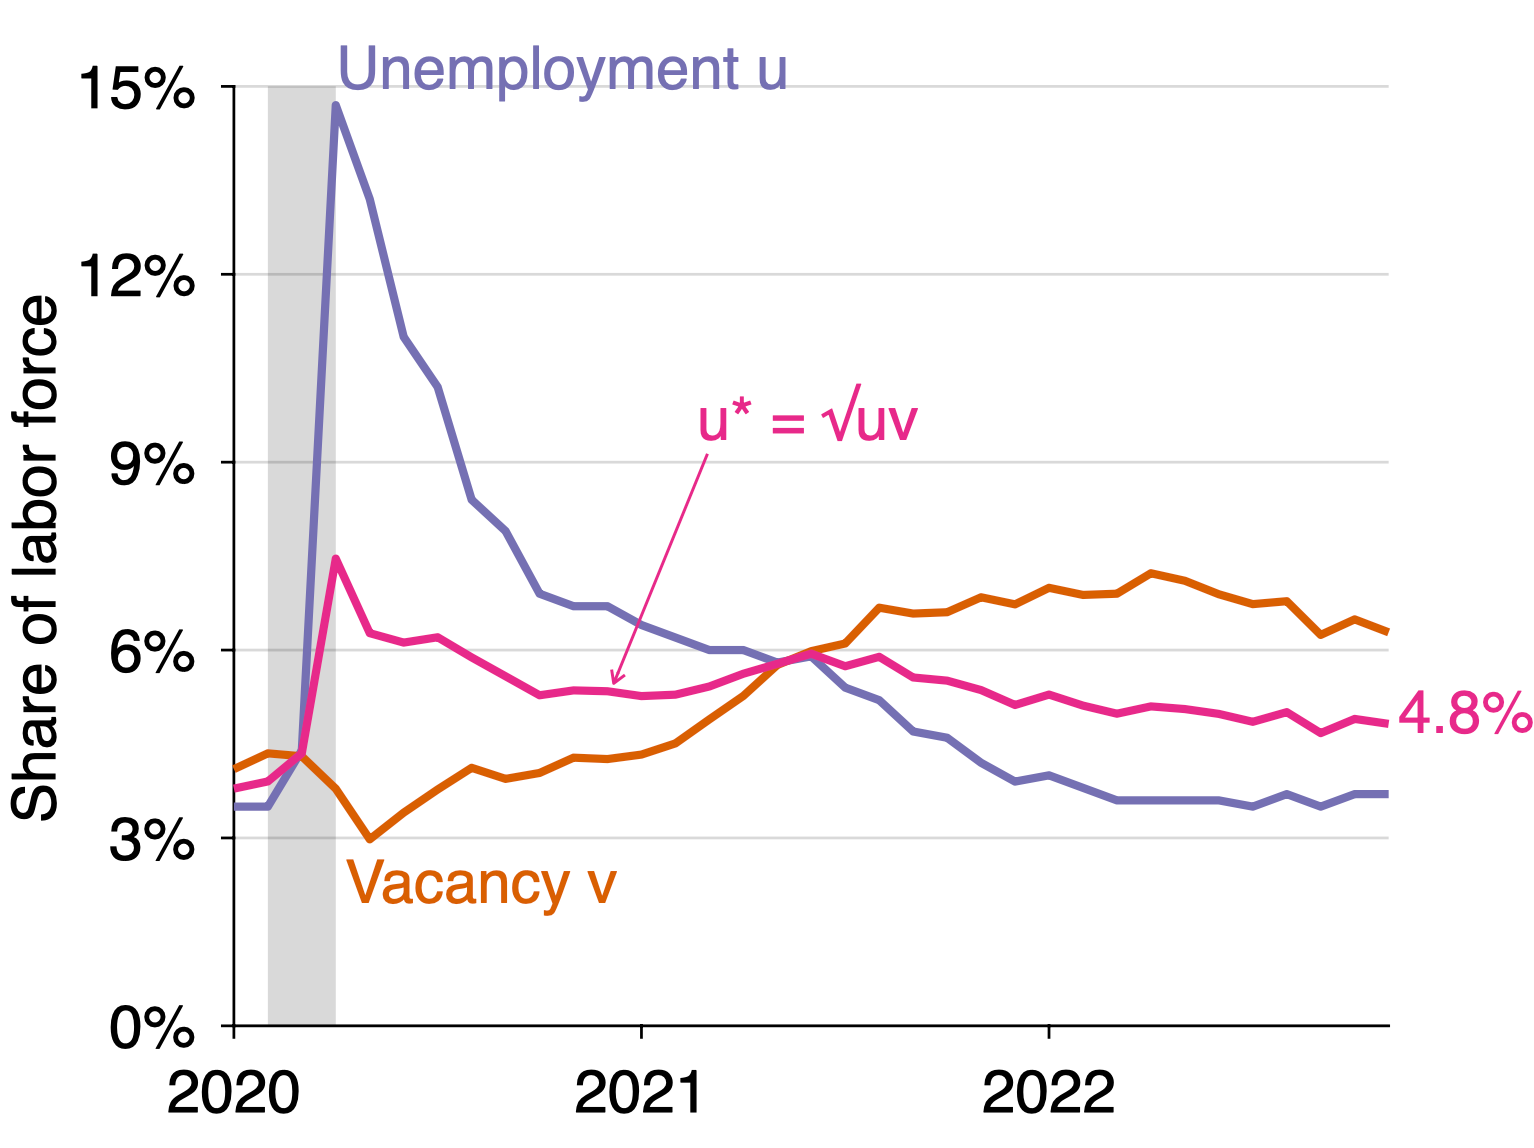
Efficient unemployment rate: u* = √uv = 4.8%. This is down from 4.9% in October 2022.
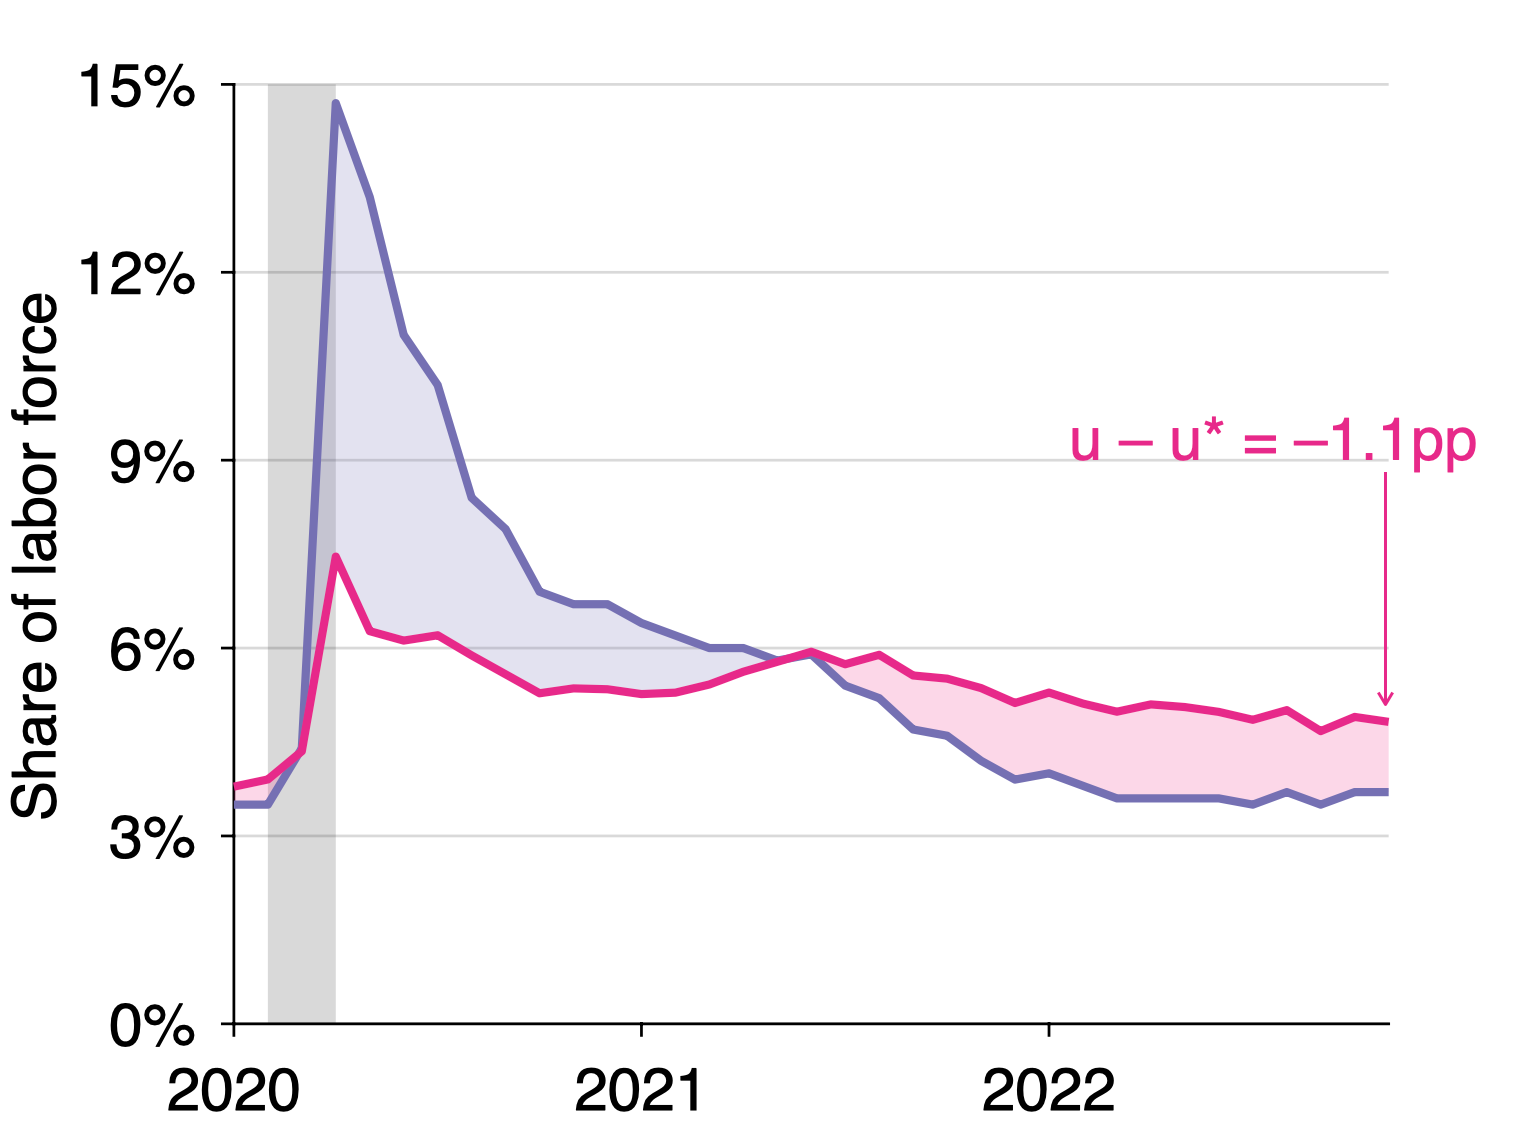
Unemployment gap: u – u* = –1.1pp. The gap has shrunk from –1.2pp in October 2022.
The construction of the efficient unemployment rate is illustrated below:
The evolution of the unemployment gap is illustrated below:
What is happening to the Beveridge curve?
The Beveridge curve in the United States is an hyperbola. This means that the unemployment rate u and vacancy rate v are related by uv = constant. This also means that if the vacancy rate falls by x%, we expect the unemployment rate to increase by x%.
For instance, the Fed has often said that it wants to bring down the vacancy rate to its pre-pandemic level. This requires to reduce the vacancy rate by 40%, from its peak value of 7% to 4.2%. Along the hyperbolic Beveridge curve, we expect the unemployment rate to increase by 40% when such drop in vacancy occurs, from 3.7% to 5.2%.
By contrast, the Fed has often said that it does not expect the unemployment rate to increase much. For such “soft landing” to occur, it must be that the Beveridge curve shifts back inward to its pre-pandemic location. Otherwise the unemployment rate would rise above 5% along the current Beveridge curve.
Below we plot the latest Beveridge curve to assess its current location. In the past few months the position of the Beveridge curve has improved slightly (further inward). However, the curve remains much further outward than before the pandemic. Let’s keep an eye on the curve in the next few months to see whether a soft landing will materialize.
Where does the methodology come from?
The formula u* = √uv for the efficient unemployment rate, and the criterion that the labor market is efficient whenever u = v, are derived in a recent paper that Emmanuel Saez and I wrote. The paper derives the result that under simple but realistic assumptions, the efficient unemployment rate is the geometric average of the unemployment and vacancy rates—that is, u* = √uv. The paper also applies the formula to the US labor market between 1930 and 2022.
I’ve seen some folks talking about how the meaning of JOLTS openings might not be consistent over time, and that something like quits is a more dependable indicator. Wonder what you think about that. In this chart (from Larry Summers) it sure looks like there’s less shifting going on using quits.
https://twitter.com/lhsummers/status/1598064189591130113