Main message: US labor-market tightness is unchanged in June 2024, at 1.2 > 1. So the labor market remains inefficiently tight, but is almost back to full employment.The FERU is 4.5%, slightly higher than in May.
The US labor-market data for June 2024 just came out. This post uses the latest numbers on vacant jobs and unemployed workers from the Bureau of Labor Statistics to compute labor-market tightness, full-employment rate of unemployment (FERU), and unemployment gap.
New developments
The US labor-market statistics for June 2024 are as follows:
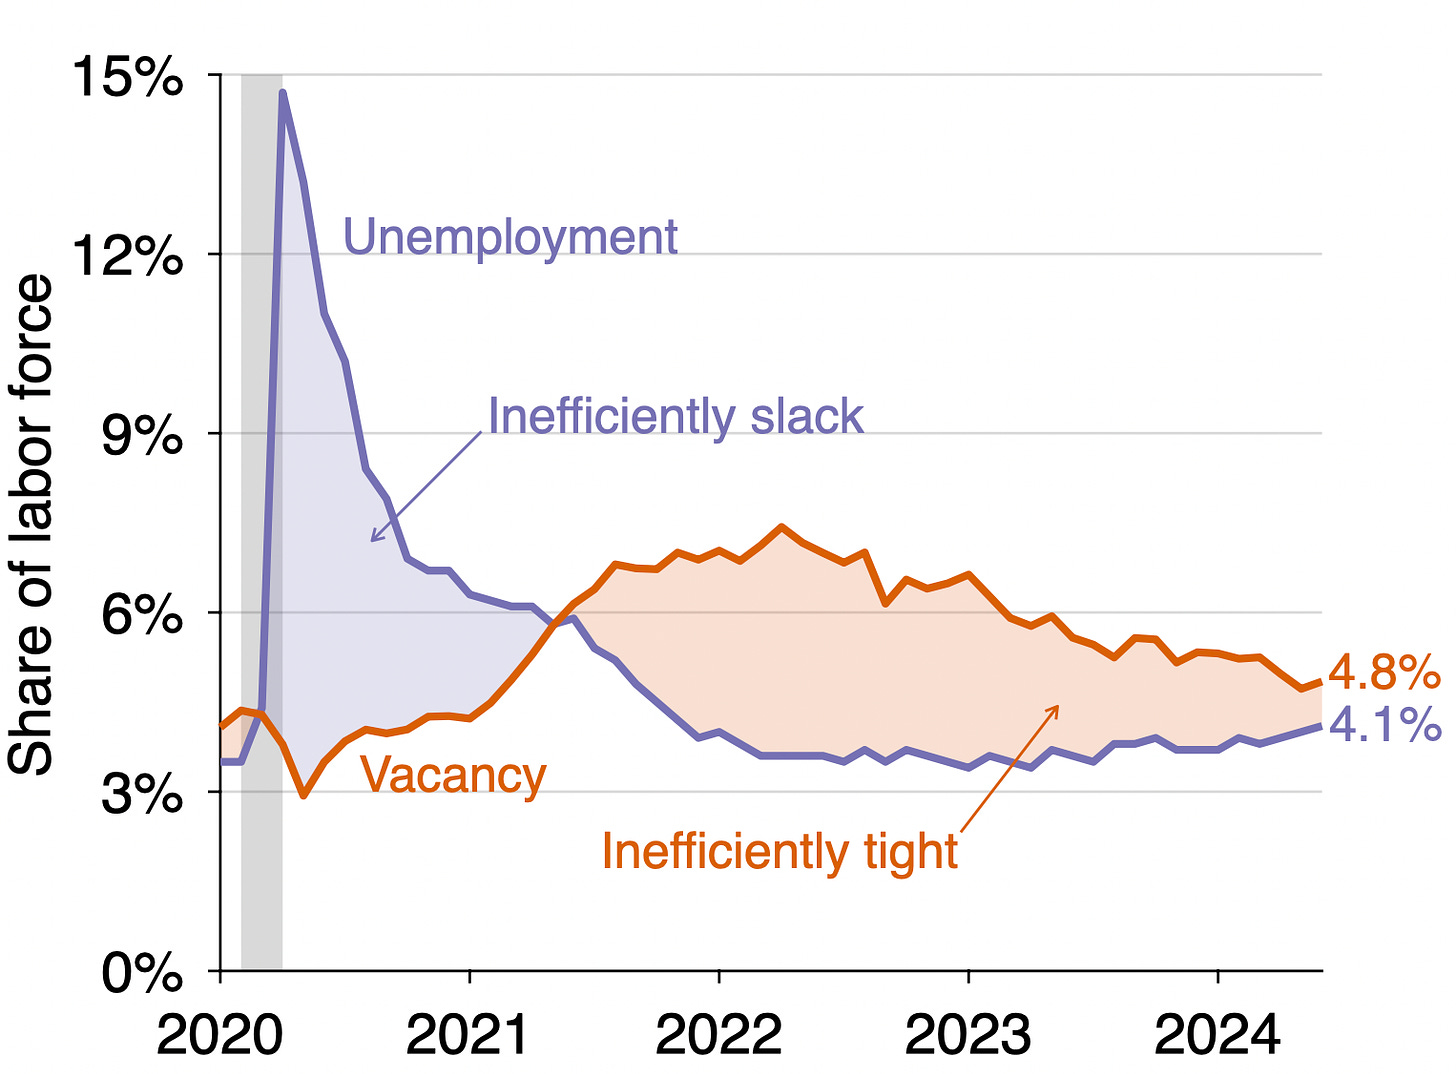
Unemployment rate: u = 4.1%. This is up from 4.0% in May.
Vacancy rate: v = 4.8%. This is up from 4.7% in May.
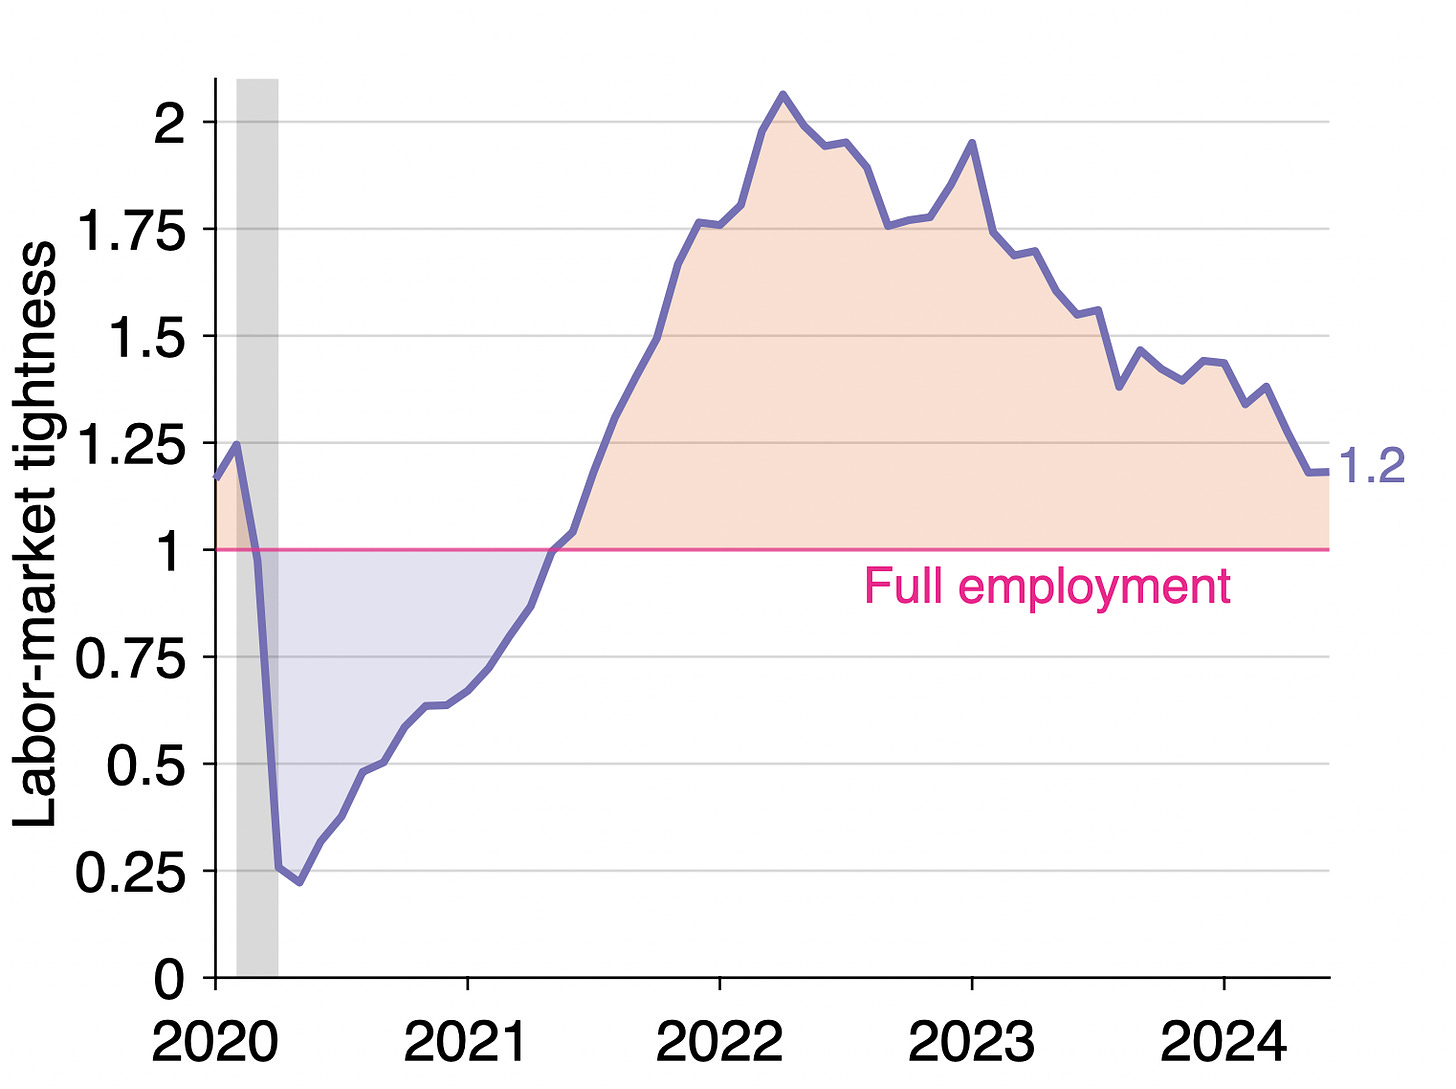
Labor-market tightness: v/u = 4.8/4.1 = 1.2. This is the same as in May.
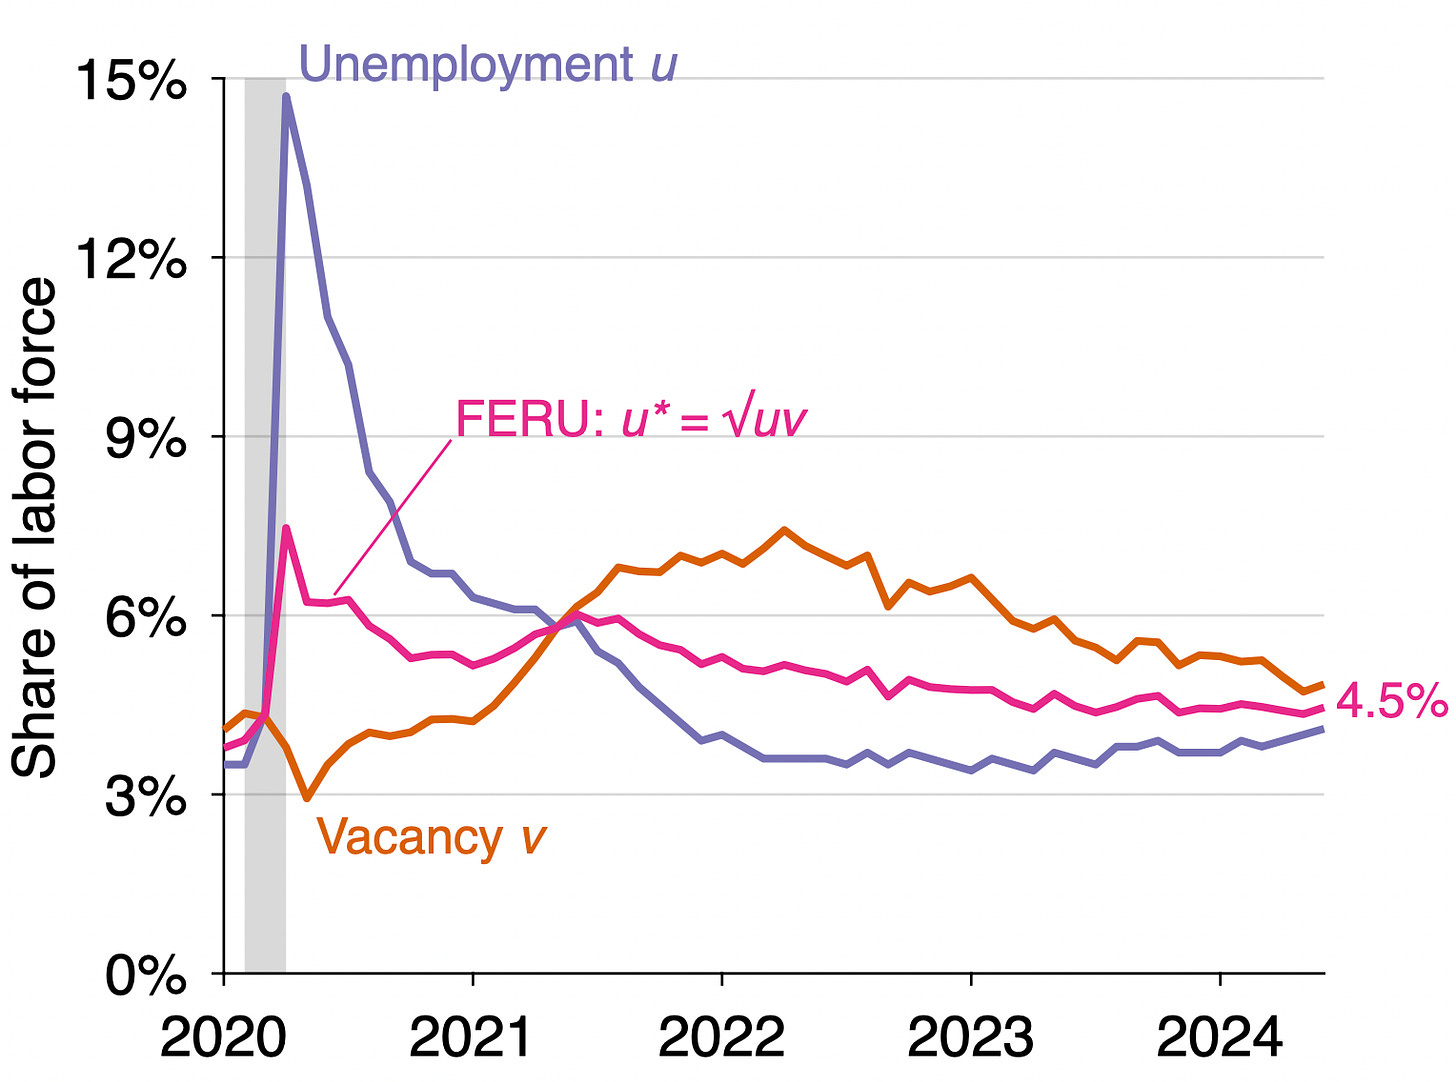
FERU: u* = √uv = √(0.041 × 0.048) = 4.5%. This is up from 4.3% in May.
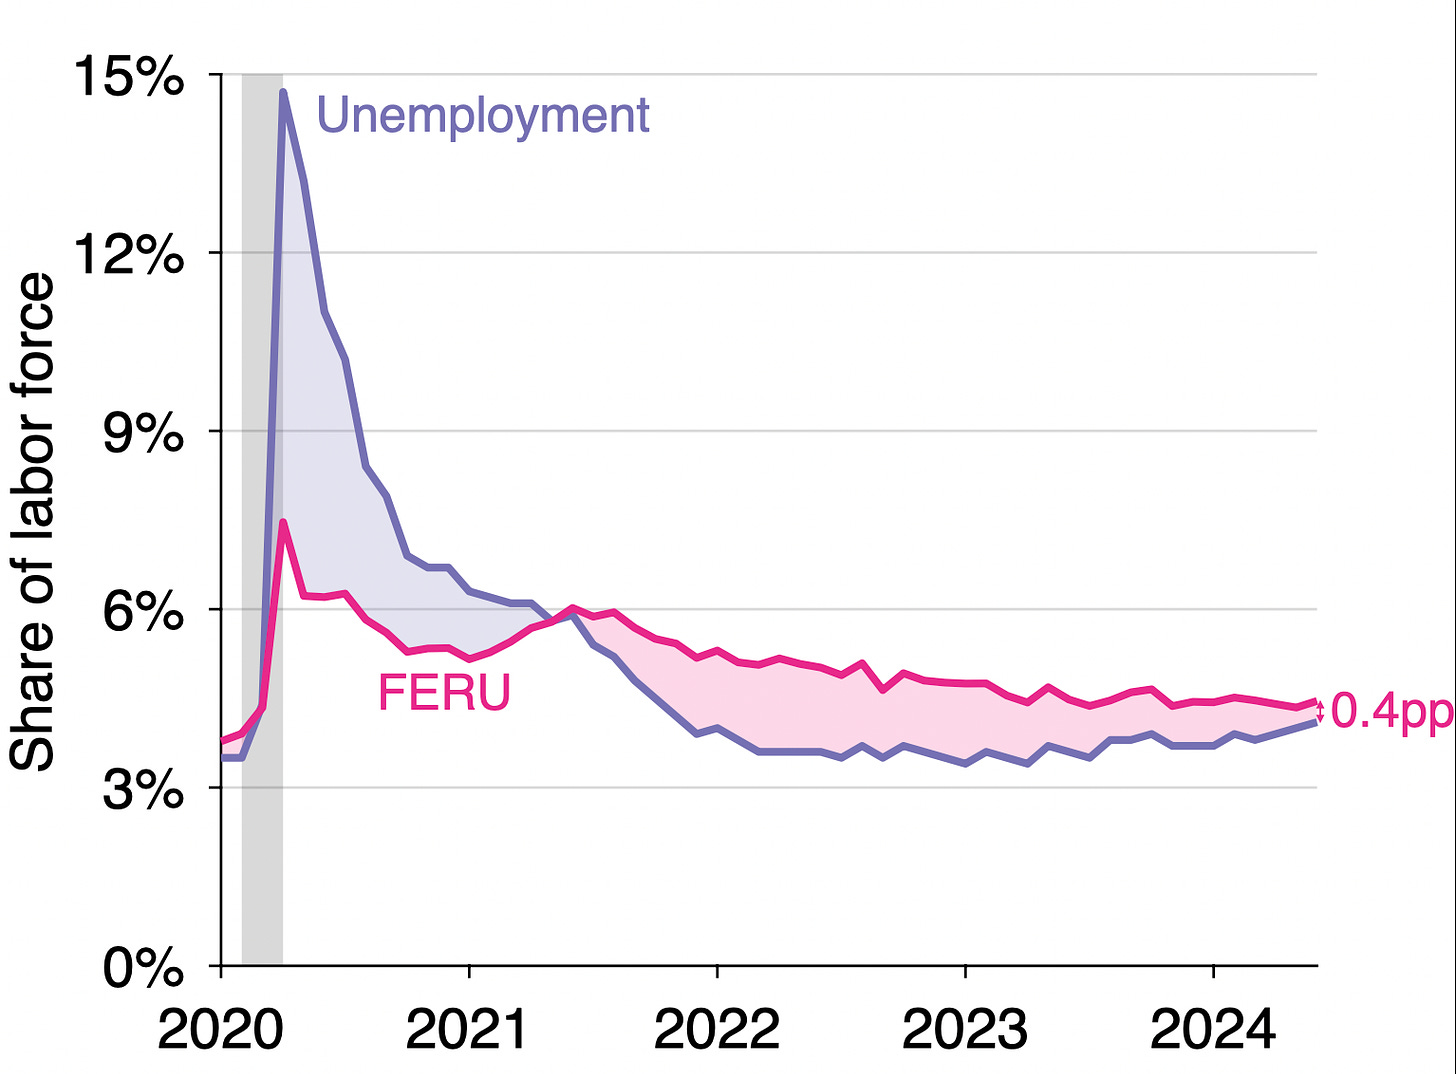
Unemployment gap: u – u* = 0.041 – 0.045 = –0.4pp. The gap grew from –0.03pp in May.
Background for readers just joining us
The FERU formula u* = √uv is derived in a newly revised paper with Emmanuel Saez. The formula implies that the labor market is at full employment when there are as many unemployed workers as vacant jobs (u = v); inefficiently tight when there are fewer unemployed workers than vacant jobs (u < v); and inefficiently slack when there are more unemployed workers than vacant jobs (u > v).
In the revised version of the paper, we extend our original analysis to the end of 2023. We have now posted the revised data and results on GitHub. The GitHub repository contains in particular:
US unemployment rate, 1930–2023
US vacancy rate, 1930–2023
US FERU, 1930–2023
US unemployment gap, 1930–2023
FERU3, FERU4, FERU5 for 1994–2023
Generalized FERU for 1951–2019
Is the US labor market too tight or too slack now?
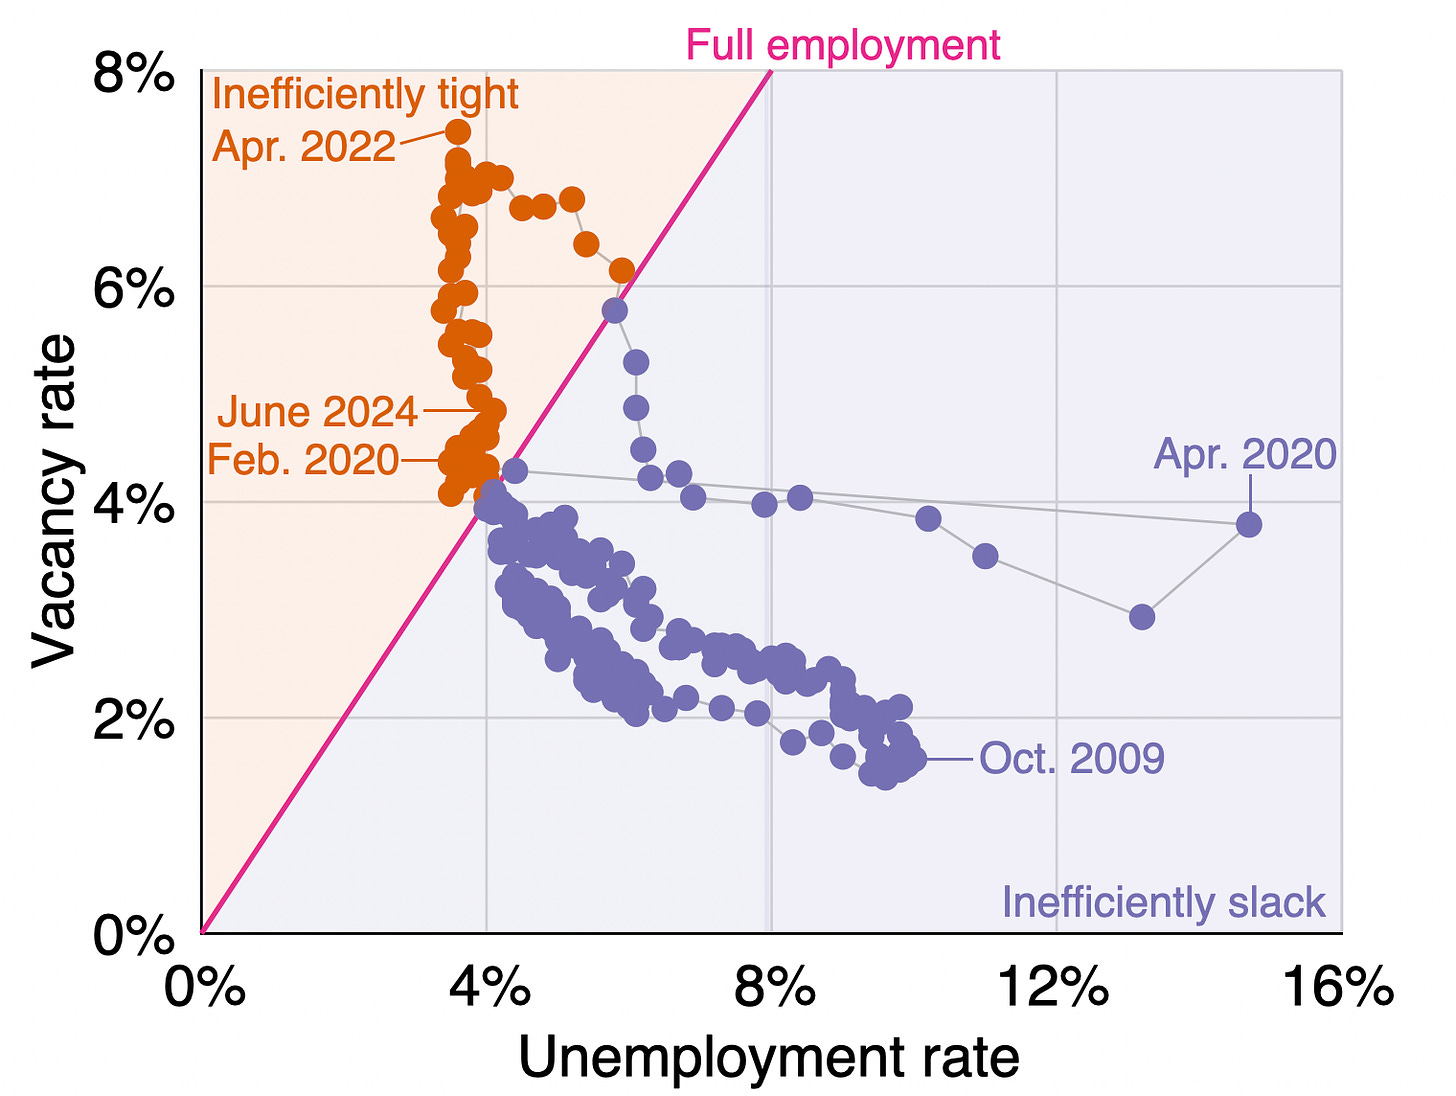
Going back to the June 2024 situation, we see that the vacancy rate is above the unemployment rate (4.8% > 4.1%), so the US labor market remains inefficiently tight. This means that the labor market is beyond full employment: the labor market is so hot that an excessive amount of labor is devoted to recruiting and hiring instead of producing. The labor market has been inefficiently tight since May 2021:
We can also see that the US labor market is inefficiently tight by looking at labor-market tightness v/u. Tightness remains above unity (1.2 > 1), which signals that the labor market is inefficiently hot:
How far is unemployment from the FERU?
Since the labor market is inefficiently tight, the actual unemployment rate remains below the FERU. The graph below illustrates the construction of the FERU:
The FERU is 0.4 percentage point above the actual unemployment rate (u = 4.1%, u* = 4.5%). This negative unemployment gap is another manifestation of an inefficiently tight labor market. Below is the evolution of the unemployment gap over the course of the pandemic. The unemployment gap has been negative (u* > u) since the middle of 2021:
How is the Beveridge curve moving?
After shifting out dramatically during the pandemic, the Beveridge curve is slowly shifting back inward. It is now almost back to its pre-pandemic position. Although the Beveridge curve remains somewhat further outward, the pre-pandemic and post-pandemic branches of the curve now overlap:


