July Labor-Market Update
US labor-market tightness falls to 1.1 in July 2024. The US labor market is now cooler than in 2019, as it approaches full employment.
Main message: US labor-market tightness falls to 1.1 in July 2024. The US labor market is now cooler than in 2019, as it approaches full employment. The FERU is 4.6%, slightly higher than in June.
The US labor-market data for July 2024 just came out. This post uses the latest numbers on vacant jobs and unemployed workers from the Bureau of Labor Statistics to compute labor-market tightness, full-employment rate of unemployment (FERU), and unemployment gap.
New developments
The US labor-market statistics for July 2024 are as follows:
Unemployment rate: u = 4.3%. This is up from 4.1% in June.
Vacancy rate: v = 4.9%. This is the same as in June.
Labor-market tightness: v/u = 4.9/4.3 = 1.1. This is down from 1.2 in June.
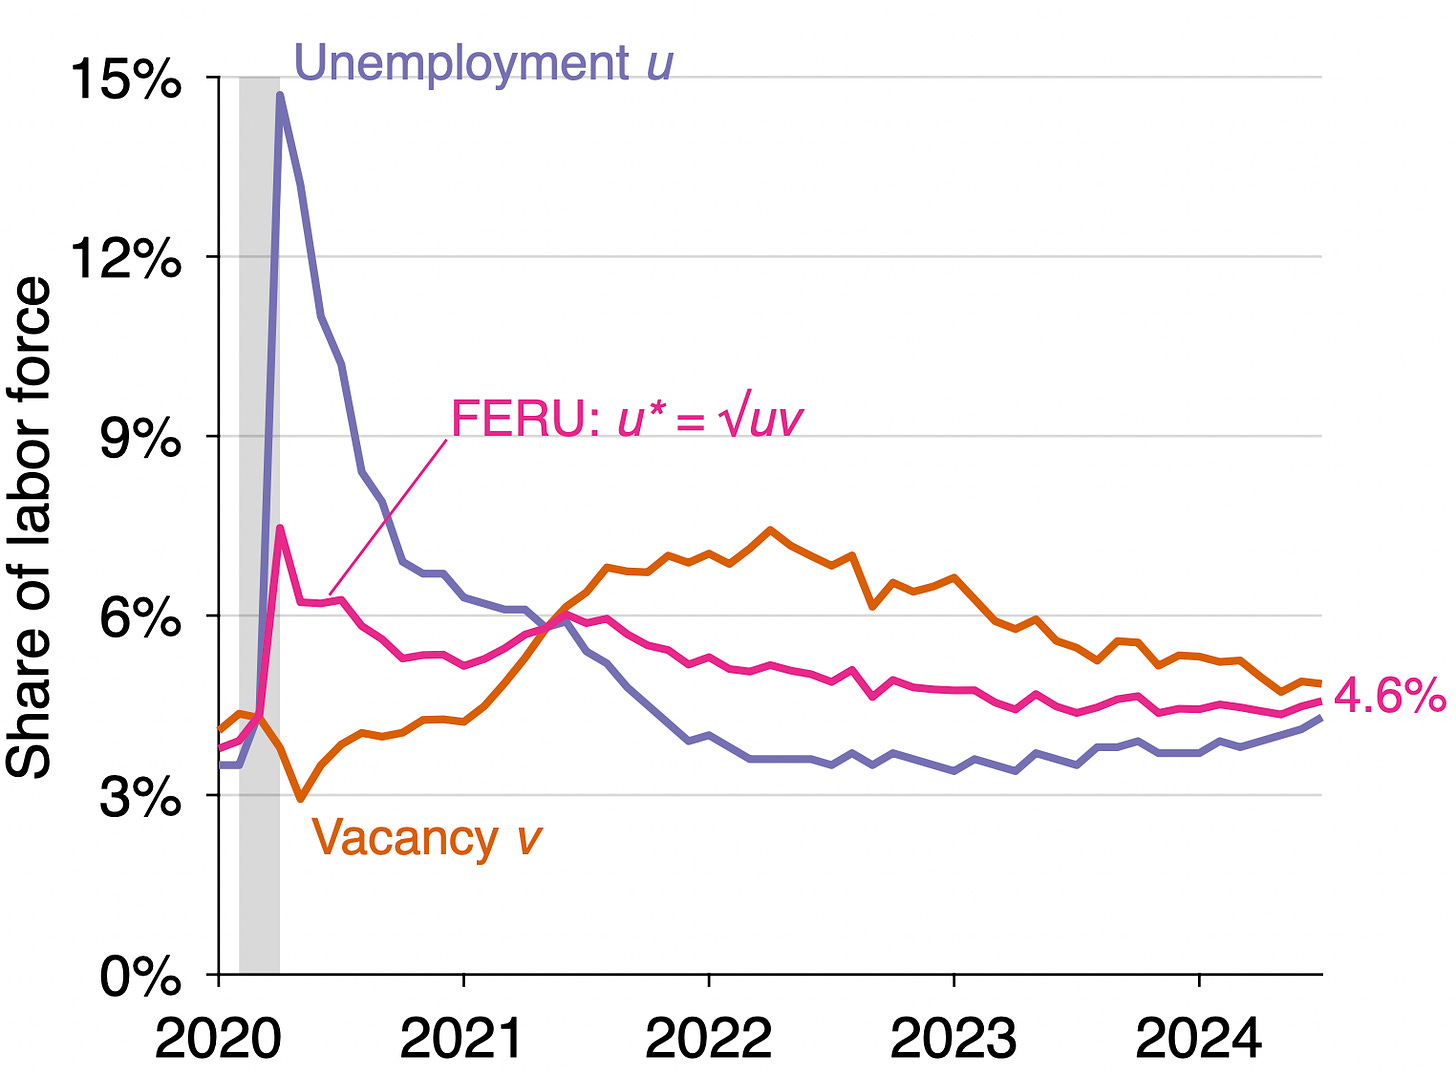
FERU: u* = √uv = √(0.043 × 0.049) = 4.6%. This is up from 4.5% in June.
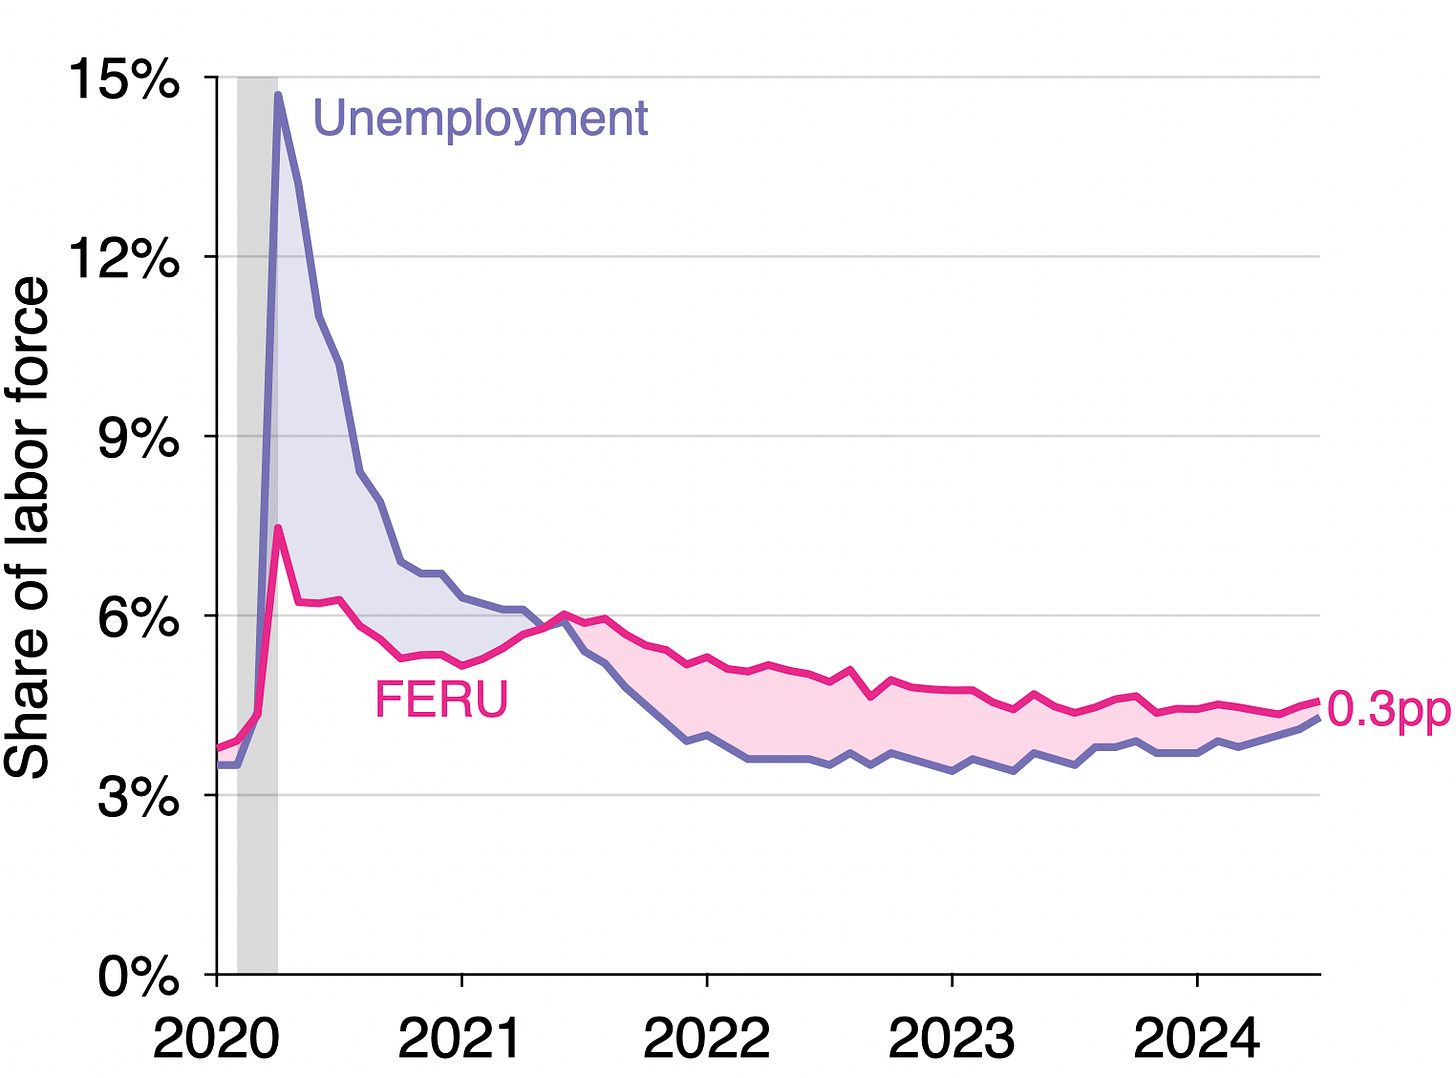
Unemployment gap: u – u* = 0.043 – 0.046 = –0.3pp. The gap shrank from -0.04pp in June.
Background for readers just joining us
The FERU formula u* = √uv is derived in a paper with Emmanuel Saez. The formula implies that the labor market is at full employment when there are as many unemployed workers as vacant jobs (u = v); inefficiently tight when there are fewer unemployed workers than vacant jobs (u < v); and inefficiently slack when there are more unemployed workers than vacant jobs (u > v). Data and results for the paper are available on GitHub.
Is the US labor market too tight or too slack now?
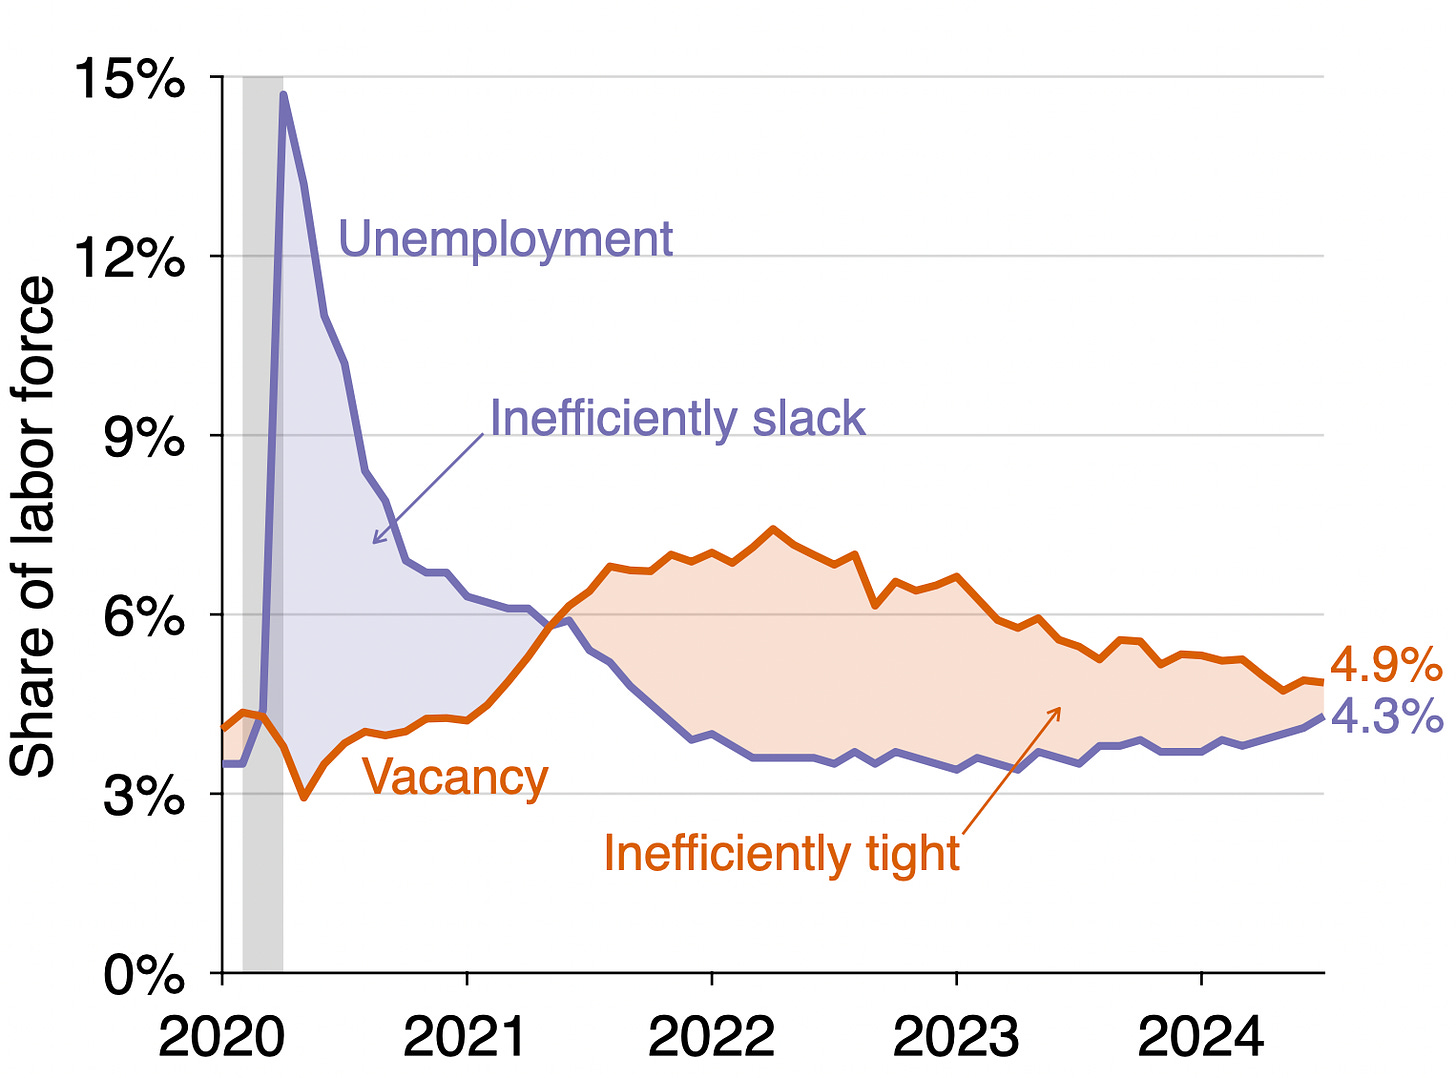
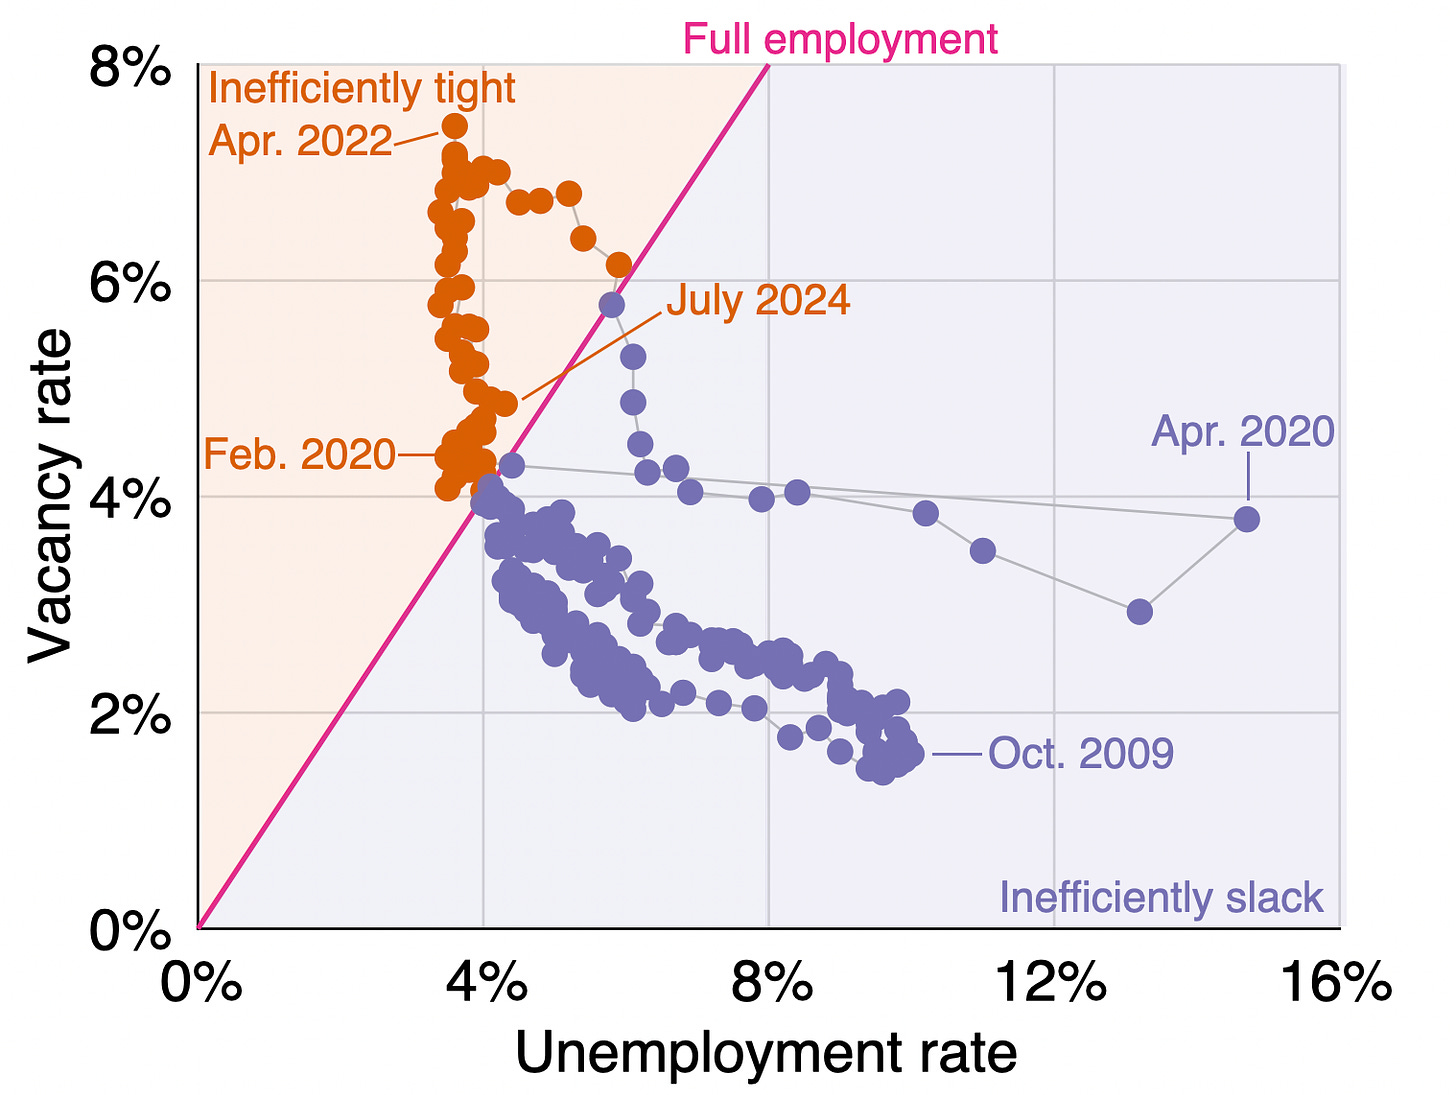
Going back to the July 2024 situation, we see that the vacancy rate is above the unemployment rate (4.9% > 4.3%), so the US labor market remains inefficiently tight. The labor market has been inefficiently tight since May 2021:
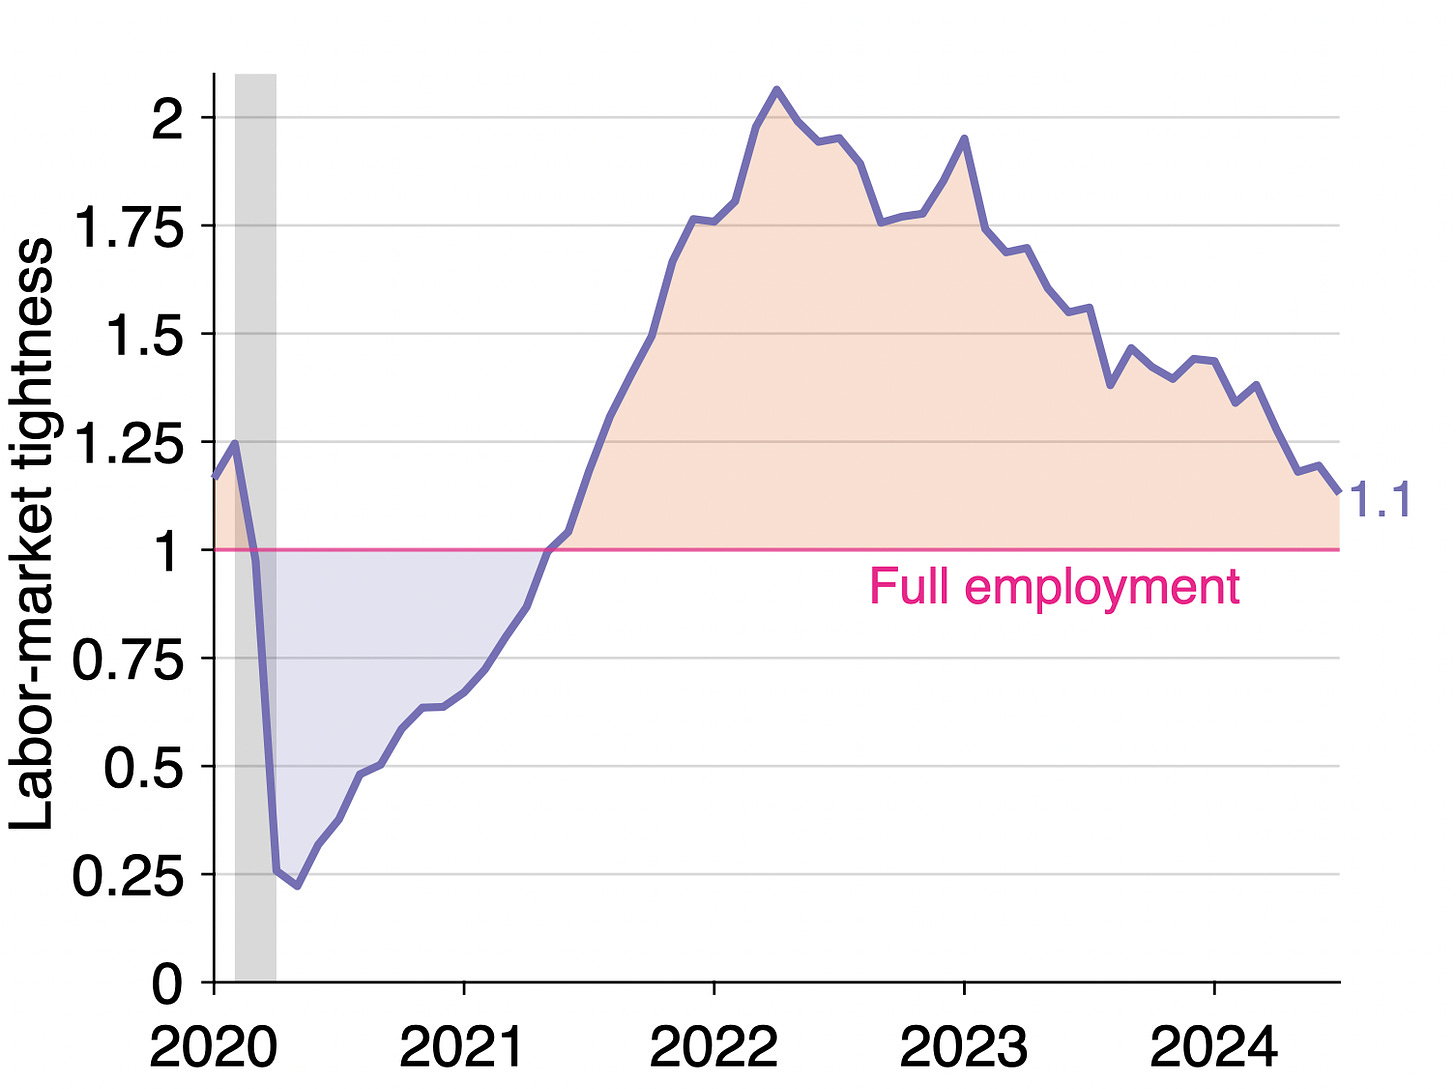
We can also see that the US labor market is inefficiently tight by looking at labor-market tightness v/u. Tightness remains above unity (1.1 > 1), which signals that the labor market is inefficiently hot. However, we can clearly see that the labor market is now approaching full employment. At this pace, the labor market should reach full employment in the next few months:
Labor-market tightness has also now fallen below its pre-pandemic level (it hovered around 1.2 in 2019 and early 2020). So the post-pandemic overheating seems now gone.
How far is unemployment from the FERU?
Since the labor market is inefficiently tight, the actual unemployment rate remains below the FERU. The graph below illustrates the construction of the FERU:
The FERU is 0.3 percentage point above the actual unemployment rate (u = 4.3%, u* = 4.6%). This negative unemployment gap is another manifestation of an inefficiently tight labor market. Below is the evolution of the unemployment gap over the course of the pandemic. The unemployment gap has been negative (u* > u) since the middle of 2021, but is now shrinking to zero:
How is the Beveridge curve moving?
After shifting out dramatically during the pandemic, the Beveridge curve has slowly shifted back inward. The curve is now almost back to its pre-pandemic position, although it remains somewhat further out. There is a possibility that the curve does not completely come back to its pre-pandemic position, which would imply a somewhat elevated FERU for the time being:


I am still not persuaded that your "full employment" is quite the real income maximizing rate of employment of labor both because search has benefits of more productive fit, not just the cost of not being employed, and because there are other factors of production that may be un- or under-employed.
This is not to say I do not think your index is useful especially as it does capture AN important aspect of income maximization and can be done with easily available data.