April Labor-Market Update
US labor-market continues cooling in April 2024, but remains inefficiently tight.
Main message: US labor-market continues cooling in April 2024, but remains inefficiently tight.
The numbers for April 2024 just came out. This post uses the latest numbers on vacant jobs and unemployed workers from the Bureau of Labor Statistics to compute labor-market tightness, full-employment rate of unemployment (FERU), and unemployment gap.
New developments
The US labor-market statistics for April 2024 are as follows:
Unemployment rate: u = 3.9%. This is up from 3.8% in March.
Vacancy rate: v = 5.1%. This is down from 5.2% in March.
Labor-market tightness: v/u = 5.1/3.9 = 1.3. This is down from 1.4 in March.
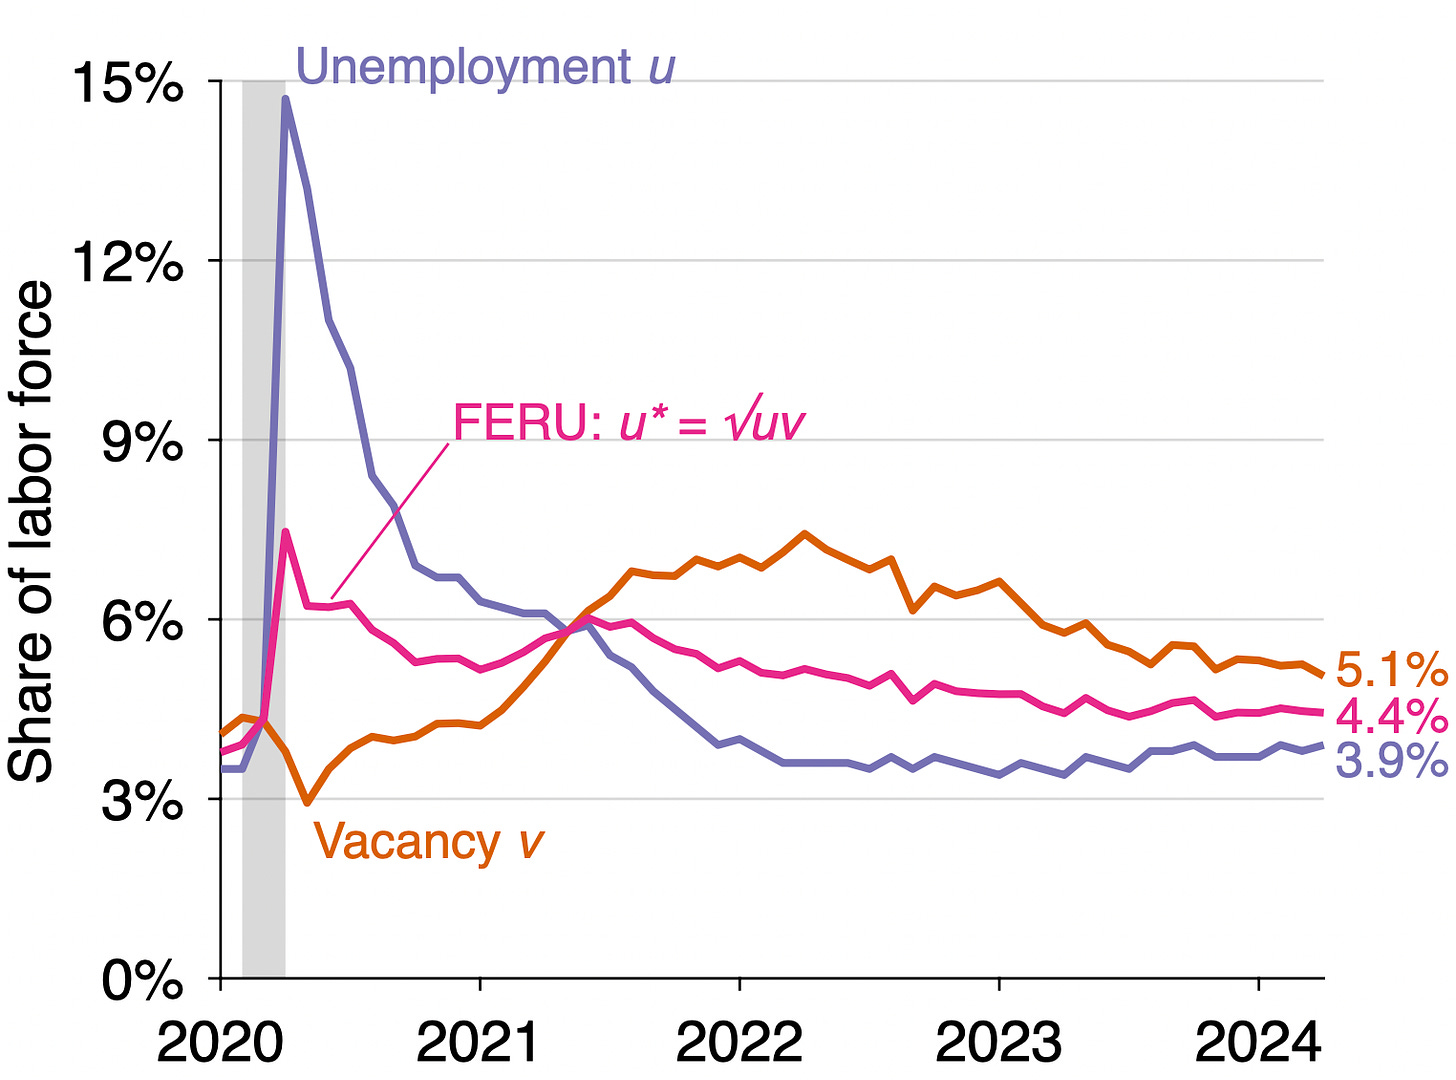
FERU: u* = √uv = √(0.039 × 0.051) = 4.4%. This is the down from 4.5% in March.
Unemployment gap: u – u* = 0.039 – 0.044 = –0.5pp. The gap shrunk from –0.07pp in March.
Background for readers just joining us
The construction of the unemployment rate and vacancy rate from data provided by the Bureau of Labor Statistics is detailed in a previous post. The FERU formula u* = √uv is derived in a recent paper with Emmanuel Saez. The formula implies that the labor market is at full employment when there are as many unemployed workers as vacant jobs (u = v); inefficiently tight when there are fewer unemployed workers than vacant jobs (u < v); and inefficiently slack when there are more unemployed workers than vacant jobs (u > v).
Is the US labor market is too tight or too slack?
Since the vacancy rate is above the unemployment rate (5.1% > 3.9%), the US labor market remains inefficiently tight. This means that the labor market is beyond full employment: the labor market is so hot that an excessive amount of labor is devoted to recruiting and hiring instead of producing. The labor market has been inefficiently tight since May 2021:
We can also see that the US labor market is inefficiently tight by looking at labor-market tightness v/u. Tightness remains above unity (1.3 > 1), which signals that the labor market is inefficiently hot:
How far is unemployment from the FERU?
Since the labor market is inefficiently tight, the actual unemployment rate remains below the FERU. The graph below illustrates the construction of the FERU:
The FERU is 0.5 percentage point above the actual unemployment rate (u = 3.9%, u* = 4.4%). This negative unemployment gap is another manifestation of an inefficiently tight labor market. Below is the evolution of the unemployment gap over the course of the pandemic. The unemployment gap has been negative (u* > u) since the middle of 2021:
How is the Beveridge curve moving?
After shifting out dramatically during the pandemic, the Beveridge curve is slowly shifting back inward. It is now quite close to its pre-pandemic position—although it remains somewhat further outward. This explains why the FERU is still higher than it was before the pandemic (4.4% > 3.8%).


Does the analysis suggest that FIAT is the wrong target? The target should be full employment as defined? What ARE the implications for monetary policy? And although we do not have handy ways to measure them, could not a lot of goods and services markets be "too hot" by this concept and what are the policy implications of that?
I wonder if the rate gap shrinking between u and u_star can have any predictive power in terms of hitting a recession in the medium term. This month we saw a 0.07 closure in the gap - given economic inertia is this too fast, too slow or just right, (or is looking at this rate not informative actually)?