February Labor-Market Update
US labor-market numbers for February 2024 are in. The labor market remains inefficiently tight, although it is slacker than in January.
The US labor-market numbers for February 2024 just came out. This post uses the latest numbers on vacant jobs and unemployed workers from the Bureau of Labor Statistics to compute three key statistics:
Labor-market tightness
Efficient unemployment rate
Unemployment gap
The US labor market cooled somewhat since January, but it remains inefficiently tight.
New developments
The US labor-market statistics for February 2024 are as follows:
Unemployment rate: u = 3.9%. This is up from 3.7% in January.
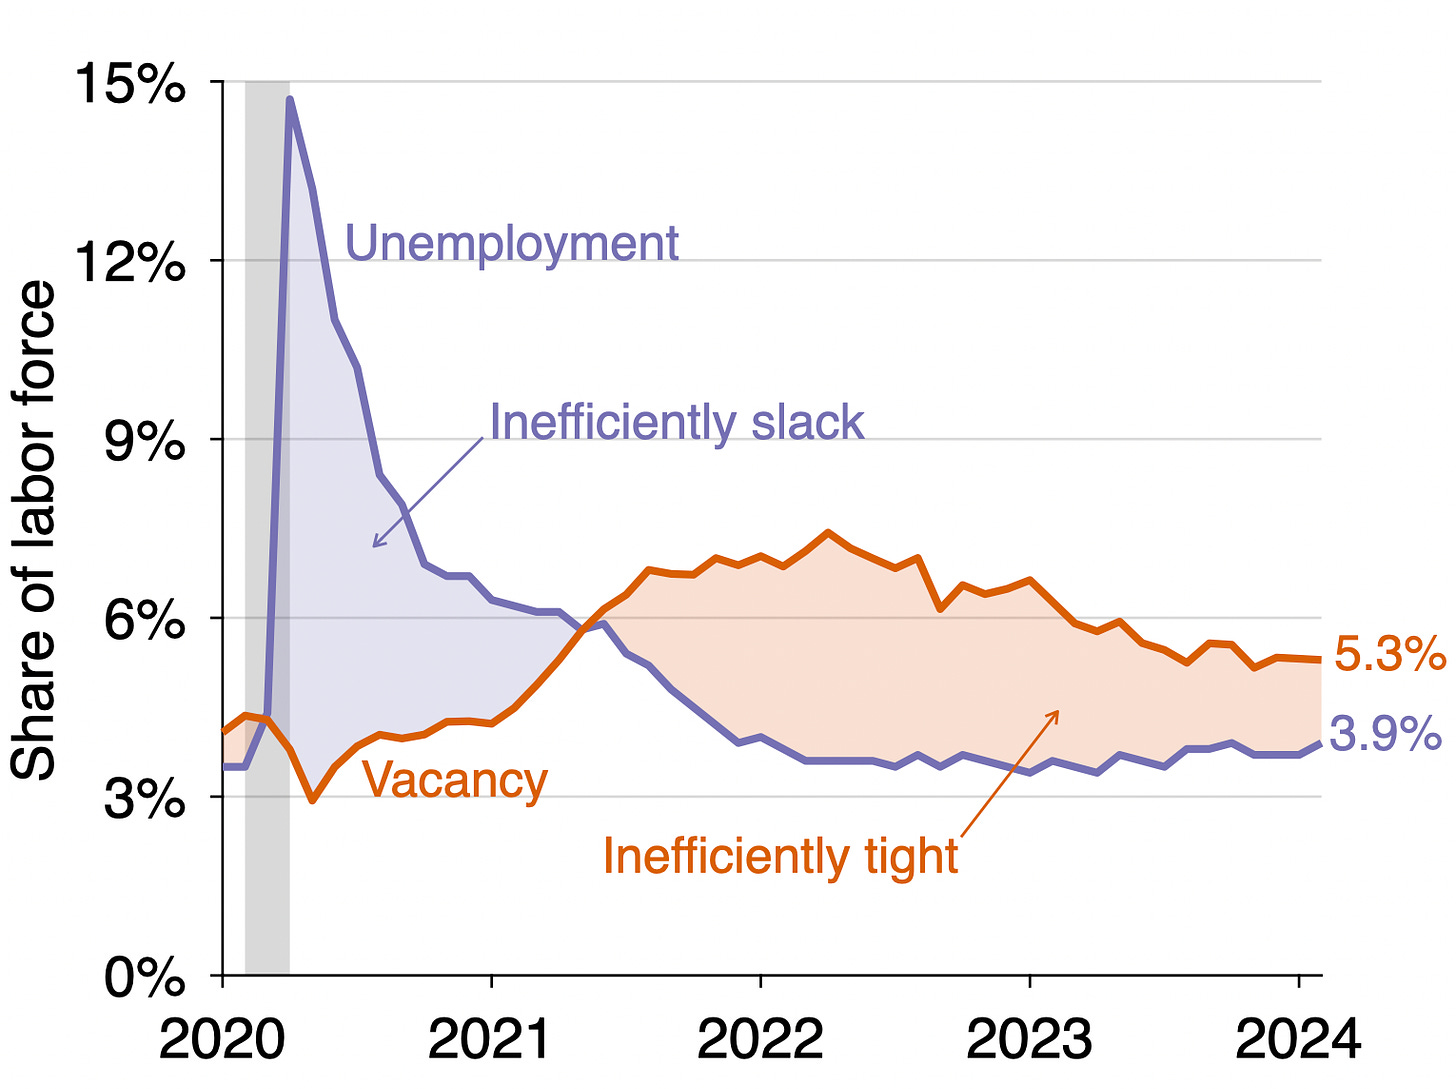
Vacancy rate: v = 5.3%. This is the same as in January.
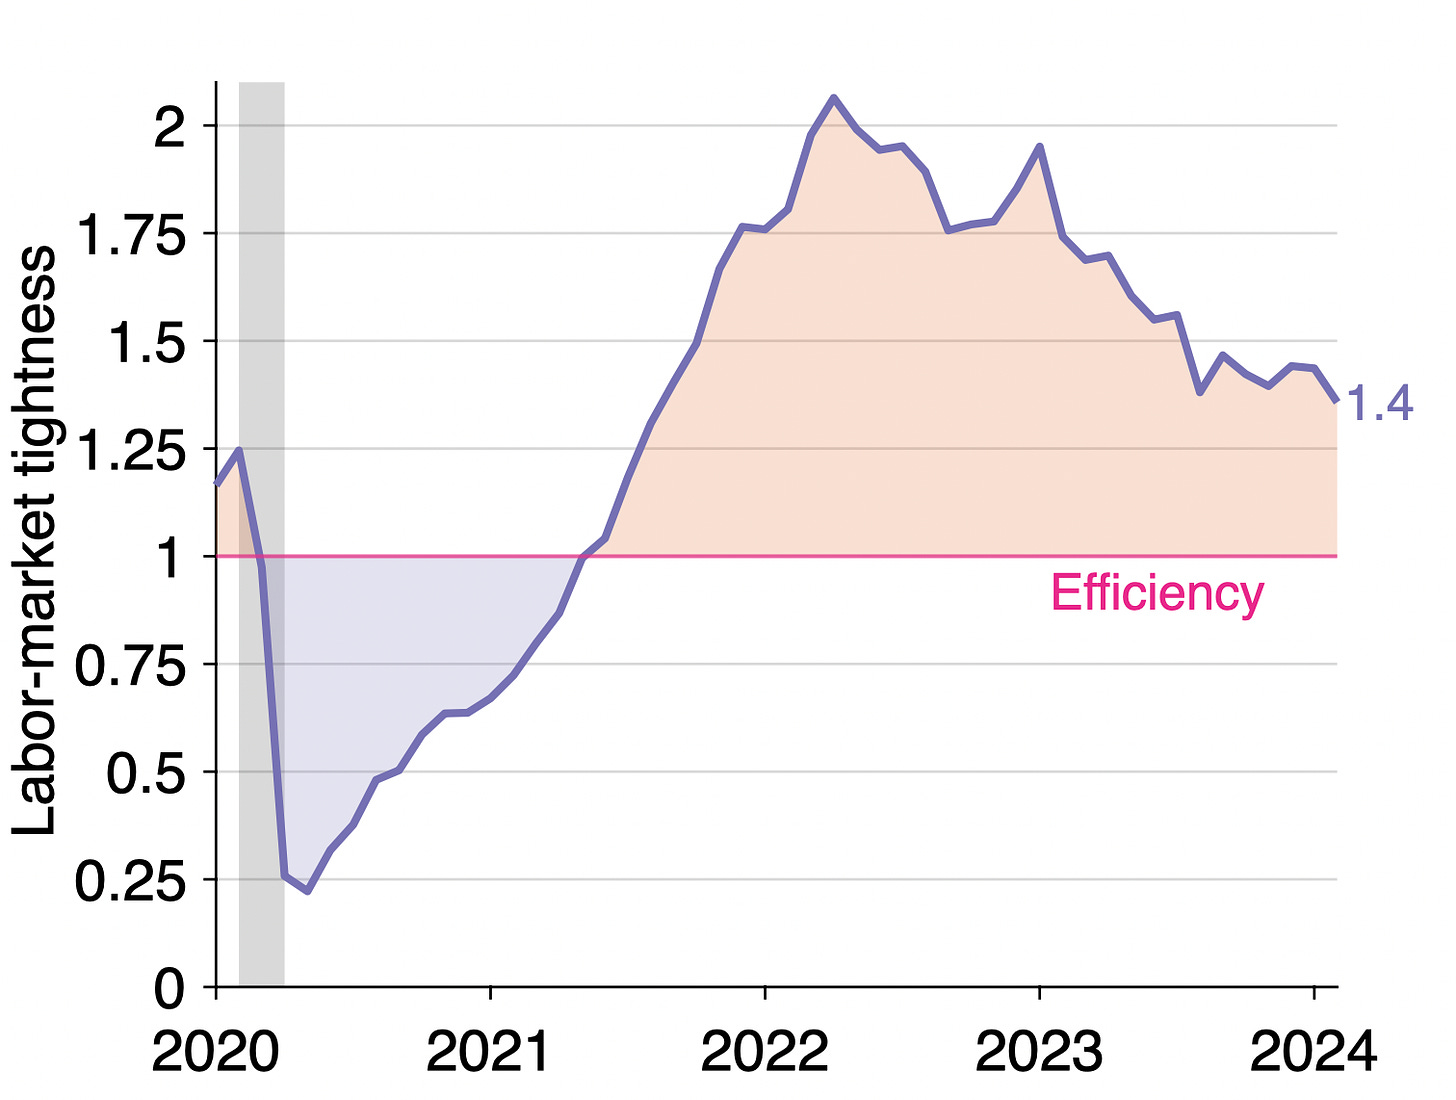
Labor-market tightness: v/u = 5.3/3.9 = 1.4. This is down from 1.5 in January.
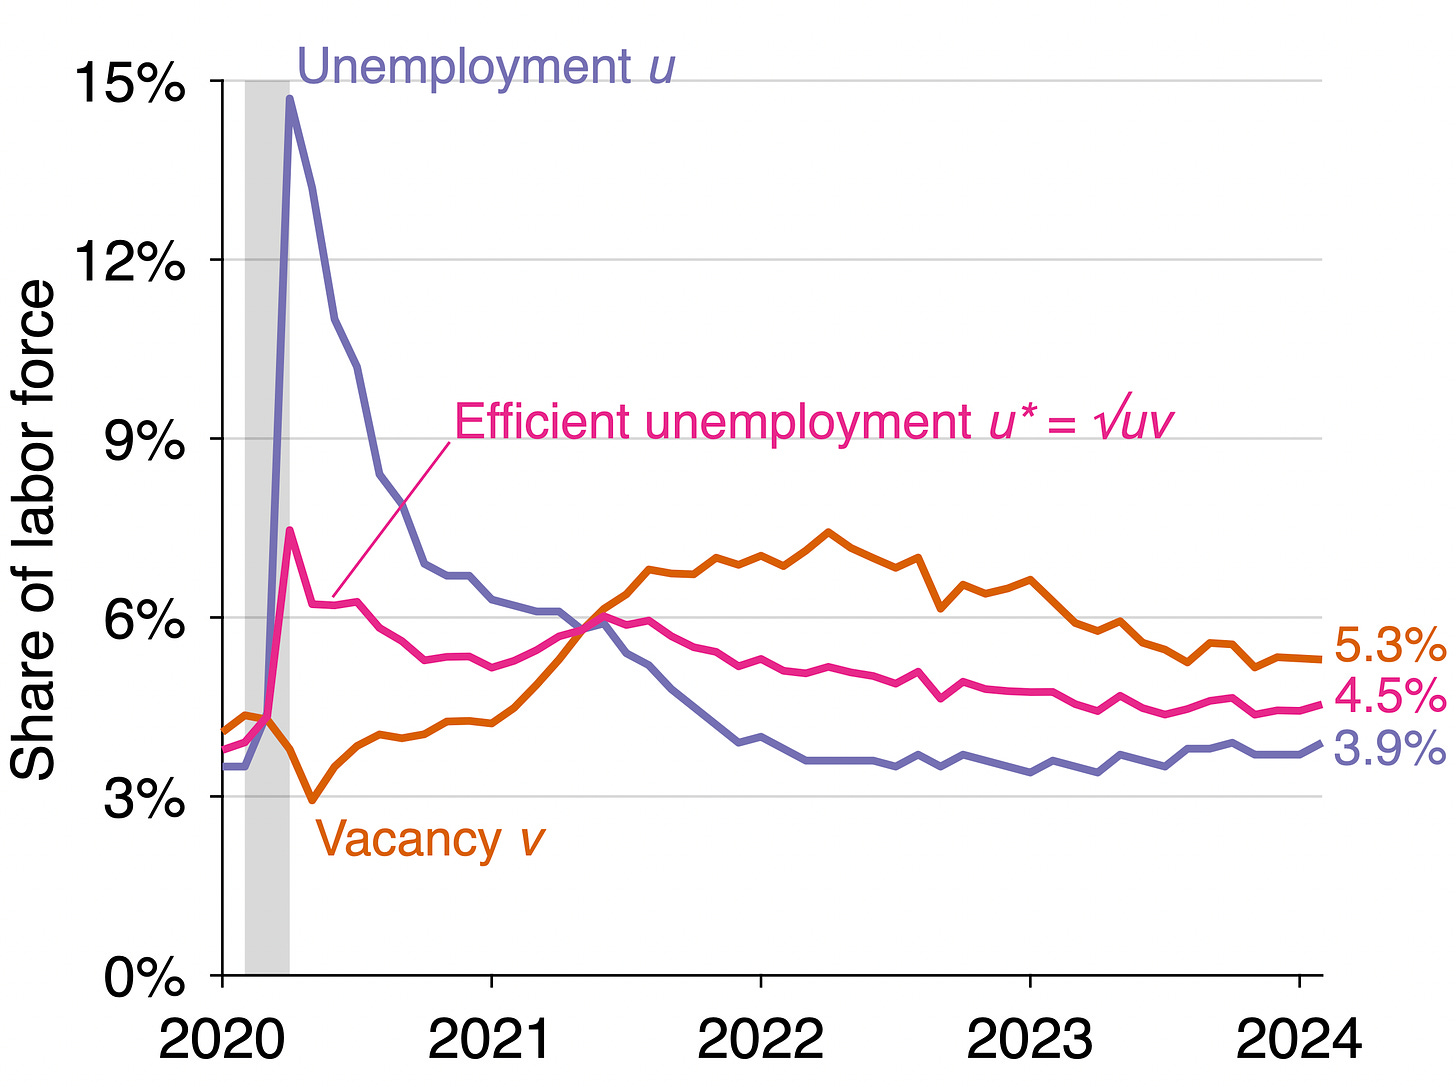
Efficient unemployment rate: u* = √uv = √(0.039 × 0.053) = 4.5%. This is up from 4.4% in December.
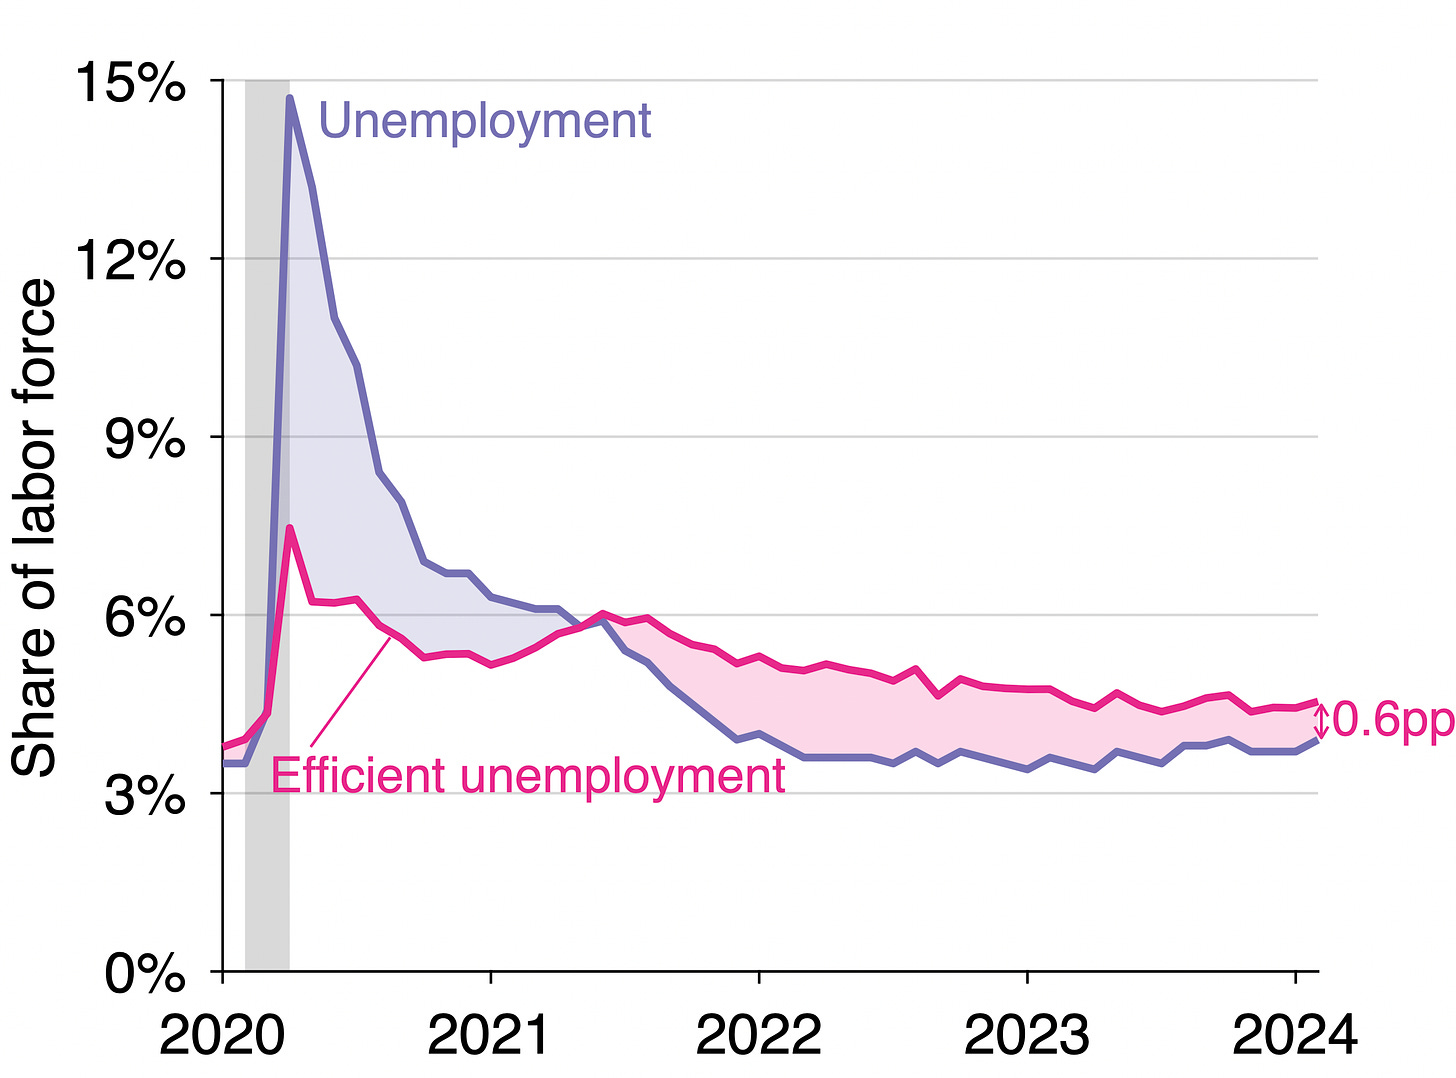
Unemployment gap: u – u* = 0.039 – 0.045 = –0.6pp. The gap shrunk from –0.07pp in January.
Background for readers just joining us
The construction of the unemployment rate and vacancy rate from data provided by the Bureau of Labor Statistics is detailed in a previous post. The formula u* = √uv for the efficient unemployment rate is derived in a recent paper by Emmanuel Saez and me. The formula implies that the labor market is efficient when there are as many unemployed workers as vacant jobs (u = v); inefficiently tight when there are fewer unemployed workers than vacant jobs (u < v); and inefficiently slack when there are more unemployed workers than vacant jobs (u > v).
Is the US labor market is too tight or too slack?
Since the vacancy rate is above the unemployment rate (5.3% > 3.9%), the US labor market remains inefficiently tight. This means that the labor market is above full employment: the labor market is so hot that an excessive amount of labor is devoted to recruiting and hiring instead of producing. The labor market has been inefficiently tight since May 2021:
We can also see that the US labor market is inefficiently tight by looking at labor-market tightness v/u. Tightness remains above unity (1.4 > 1), which signals that the labor market is inefficiently hot:
How far is unemployment from its efficient rate?
Since the labor market is inefficiently tight, the actual unemployment rate remains below the efficient unemployment rate. The graph below illustrates the construction of the efficient unemployment rate:
The efficient unemployment rate is 0.6 percentage point above the actual unemployment rate (u* = 4.5% while u = 3.9%). This negative unemployment gap is another manifestation of an inefficiently tight labor market. Below is the evolution of the unemployment gap over the course of the pandemic. The unemployment gap has been negative (u* > u) since the middle of 2021:
Implications for monetary policy
One of the mandates of monetary policy is to maintain the economy at full employment—so to maintain unemployment at its efficient rate, u*.
Unemployment is currently below its efficient rate, so a static reasoning suggests that monetary policy should continue to tighten to cool aggregate demand and labor demand. However, monetary policy only affects the economy slowly. In the past two years, the Fed has raised the fed funds rate by 5.25pp. Only a fraction of that increase has taken effect. The rest might be enough to bring the unemployment rate to its efficient level.
Indeed, given a monetary multiplier of 0.5, we would expect the total increase in interest rates to raise the unemployment rate by 5.25 × 0.5 = 2.6pp. The unemployment gap in mid-2022, when the Fed started tightening, was -1.6pp. Everything else equal, we would expect the unemployment gap to turn positive once monetary policy has been fully absorbed, at -1.6 + 2.6 = 1.0pp. Under this basic scenario, the current monetary tightening would be sufficient to bring the labor market to efficiency—and maybe even to the inefficient slack territory.
Of course, this recommendation does not take into account inflation. This is purely to improve the allocation of labor between producing, recruiting, and jobseeking. However, in a new paper, Emmanuel Saez and I find that in a macroeconomic model with unemployment, under standard pricing assumptions, the Phillips curve is such that the divine coincidence prevails. That is, the Phillips curve ensures that whenever the economy is at full employment, inflation is on target, at 2%.
In such a model, the Fed’s two mandates coincide: by keeping the economy at full employment, the Fed also maintains inflation at 2%. So, targeting the efficient unemployment rate u* = √uv might be the only thing that the Fed should worry about, and they might have done enough to reach it.
More about economic slack
There is always some slack in the economy. Sometimes there is far too much of it, and sometimes there is too little of it—in the current economy for instance. I have just finished teaching a PhD course on the topic at UCSC. Lecture videos, lecture notes, and readings are publicly available online.
Two sections of the course are particularly related to this post. There is a section in which we derive the result that u* = √uv and apply it to the US labor market. And in a follow-up section, we discuss the implications of the formula for monetary policy.


Interesting looking course. I'd encourage you to think about tweaking it so not (implicitly) to depend on a one good, one input ("labor") model. It a multi-good, multi-input model, slack, u and v all become vectors not scalar variables.
"One of the mandates of monetary policy is to maintain the economy at full employment—so to maintain unemployment at its efficient rate."
I think a better way of thinking about the Fed's Congressional mandate is that the Fed should maintain a res income-maximizing rate of inflation. Labor market efficiency would conceptually enter by affecting what inflation rate maximizes real income.
BTW, I agree with you that the Fed should be (since December) feeling out a lower EFFR.